. 2020 Mar 9;61(3):6.
doi: 10.1167/iovs.61.3.6.

Transcriptomic Analysis of the Developmental Similarities and Differences Between the Native Retina and Retinal Organoids

Affiliations

Transcriptomic Analysis of the Developmental Similarities and Differences Between the Native Retina and Retinal Organoids

Zekai Cui et al. Invest Ophthalmol Vis Sci. .

Abstract

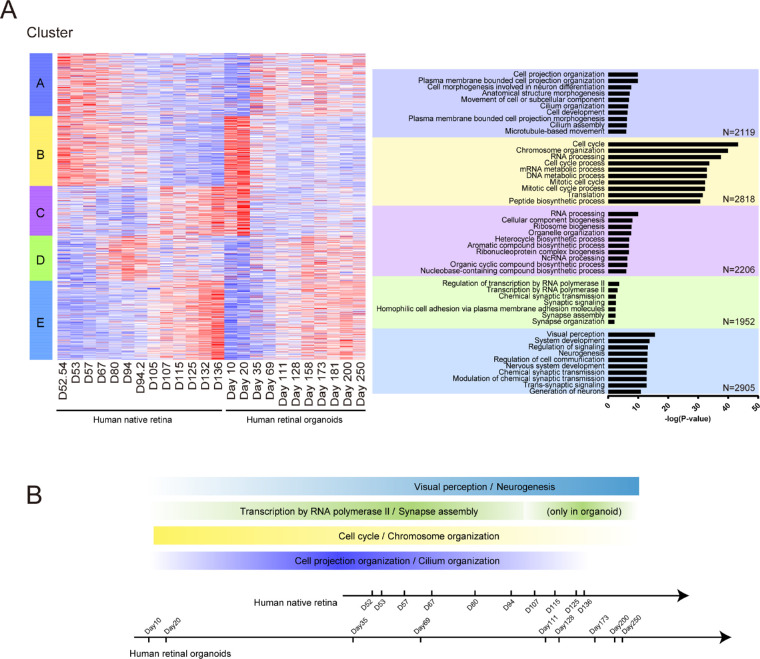
Purpose: We performed a bioinformatic transcriptome analysis to determine the alteration of gene expression between the native retina and retinal organoids in both mice and humans.

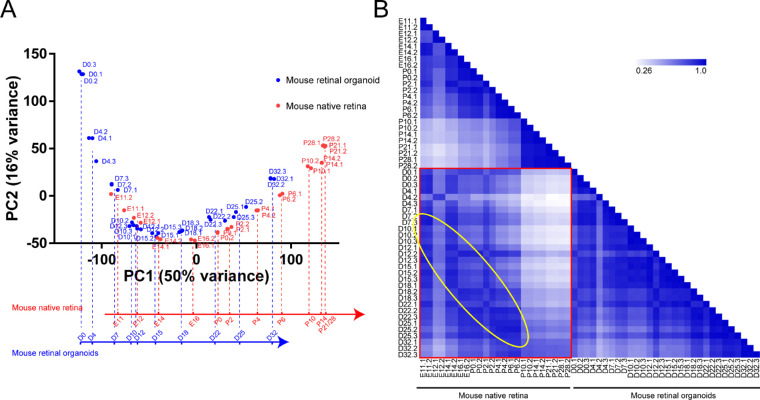
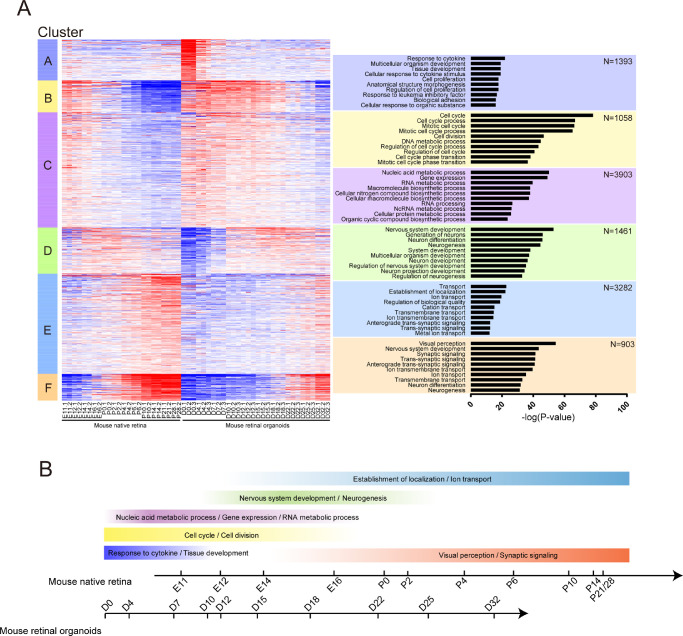
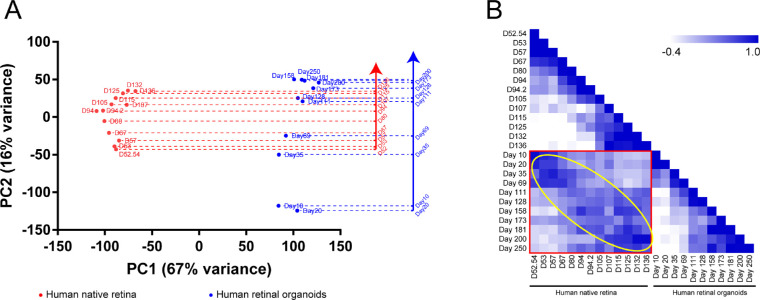
Methods: The datasets of mouse native retina (GSE101986), mouse retinal organoids (GSE102794), human native retina (GSE104827), and human retinal organoids (GSE119320) were obtained from Gene Expression Omnibus. After normalization, a principal component analysis was performed to categorize the samples. The genes were clustered to classify them. A functional analysis was performed using the bioinformatics tool Gene ontology enrichment to analyze the biological processes of selected genes and cellular components.

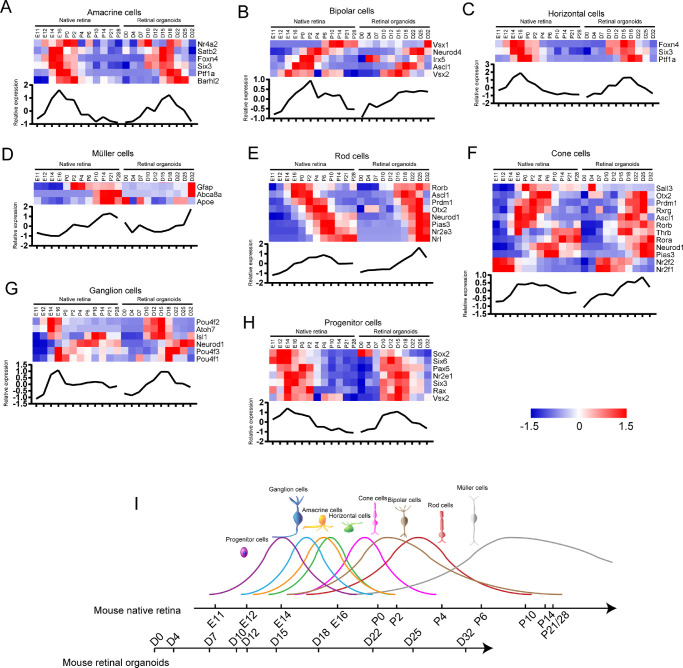
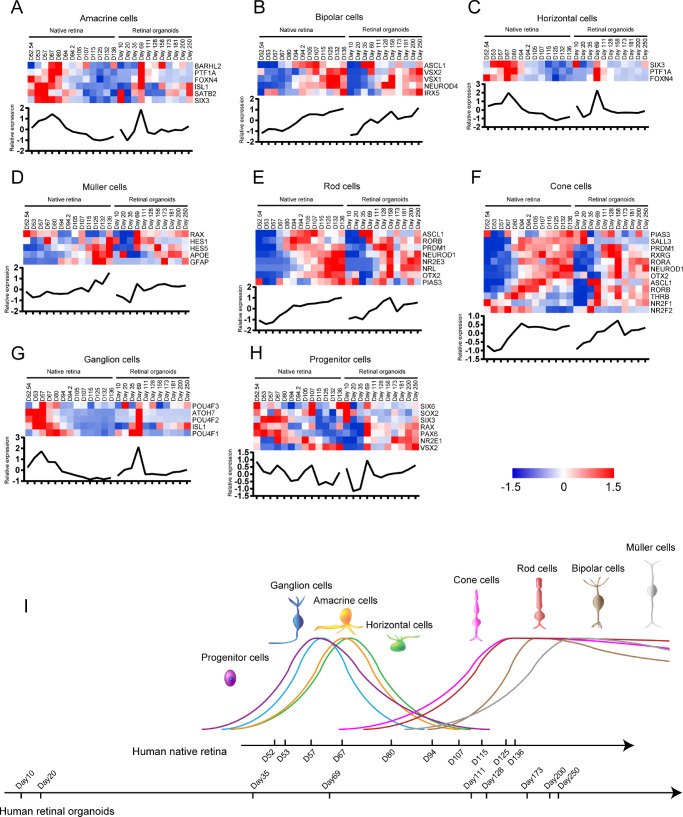
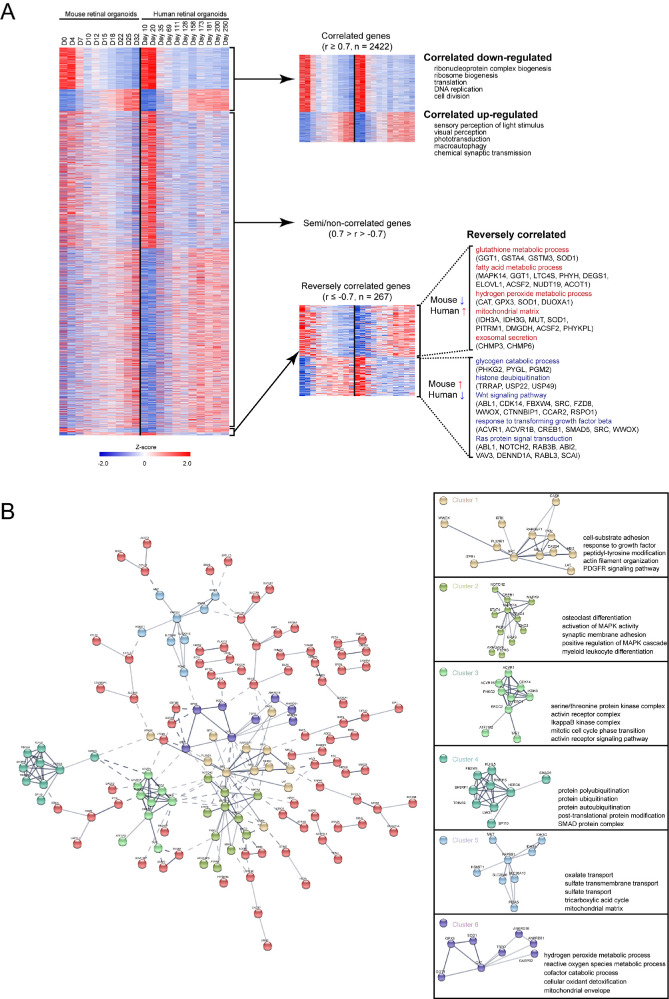
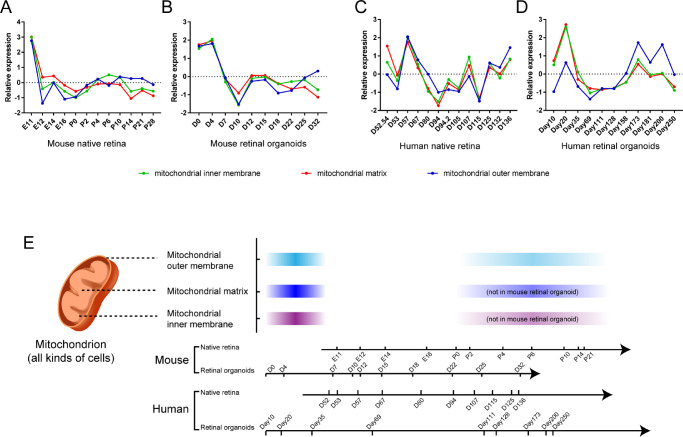
Results: The development of retinal organoids is slower than that in the native retina. In the early stage, cell proliferation predominates. Subsequently, neural differentiation is dominant. In the later stage, the dominant differentiated cells are photoreceptors. Additionally, the fatty acid metabolic process and mitochondria-related genes are upregulated over time, and the glycogen catabolic process and activin receptors are gradually downregulated in human retinal organoids. However, these trends are opposite in mouse retinal organoids. There are two peaks in mitochondria-related genes, one in the early development period and another during the photoreceptor development period. It takes about five times longer for human retinal development to achieve similar levels of mouse retinal development.

Conclusions: Our study reveals the similarities and differences in the developmental features of retinal organoids as well as the corresponding relationship between mouse and human retinal development.


Conflict of interest statement

Disclosure: Z. Cui, None; Y. Guo, None; Y. Zhou, None; S. Mao, None; X. Yan, None; Y. Zeng, None; C. Ding, None; H. Chan, None; S. Tang, None; L. Tang, None; J. Chen, None

Figures

Figure 1.
Figure 1.
The sample features of mouse native retina and retinal organoids. (A) PCA plot shows a comparison of the transcriptome data between mouse native retina and retinal organoids. PC1 on the x axis corresponds with the developmental time. The mapping of sample points in the x axis represents their relative position during development. (B) Pearson's correlation coefficient is performed to show the correlation between the two groups of samples. The yellow circle indicates that the two groups of samples are consistent over time.
Figure 2.
Figure 2.
Cluster analysis in mouse native retina and retinal organoids. (A, left) Heatmap of all genes expressed in mouse native retina and retinal organoids. Genes were clustered into six clusters based on gene expression over time. Heatmaps were generated using Z scores of expressed genes. (Right) Top significant biological processes enriched in each cluster based on GO analysis. (B) The relationship between time and the significant GO terms in mouse native retina and retinal organoids. Color depth represents the gene relative expression.
Figure 3.
Figure 3.
The developmental time of each neural retinal cell type in mouse native retina and retinal organoids. (AH) Heatmaps show the relative expression of specific TFs in each neural retinal cell type. The curves of average expression are displayed below each heatmap. Heatmaps were generated using Z scores of expressed genes. (I) The developmental timeline of various neural retinal cells in mouse native retina and retinal organoids. Curve height represents the relative birth rate of cells.
Figure 4.
Figure 4.
The sample features of human native retina and retinal organoids. (A) PCA plot shows a comparison of the transcriptome data between human native retina and retinal organoids. PC2 on the y axis corresponds with the developmental time. The mapping of sample points in the y axis represents their relative position during development. (B) Pearson's correlation coefficient is performed to show the correlation between the two groups of samples. The yellow circle indicates that the two groups of samples are consistent over time.
Figure 5.
Figure 5.
Cluster analysis in human native retina and retinal organoids. (A, left) Heatmap of all genes expressed in human native retina and retinal organoids. Genes were clustered into five clusters based on gene expression over time. Heatmaps were generated using Z scores of expressed genes. (Right) Top significant biological processes enriched in each cluster based on GO analysis. (B) The relationship between time and the significant GO terms in human native retina and retinal organoids. Color depth represents the gene relative expression.
Figure 6.
Figure 6.
The developmental time of each neural retinal cell type in human native retina and retinal organoids. (AH) Heatmaps show the relative expression of specific TFs in each neural retinal cell type. The curves of average expression are displayed below each heatmap. Heatmaps were generated using Z scores of expressed genes. (I) The developmental timeline of various neural retinal cells in human native retina and retinal organoids. Curve height represents the relative birth rate of cells.
Figure 7.
Figure 7.
Comparison between mouse and human retinal organoid. (A) Pearson correlation of mouse and human retinal organoid. There were 2422 genes that were highly correlated between mouse and human retinal organoid (Pearson correlation coefficient, r ≥ 0.7). There were 267 genes that were reversely correlated (r ≤ –0.7). Enriched GO terms for the correlated and reversely correlated genes are presented. Heatmaps were generated using Z scores of expressed genes. (B) Protein–protein interaction (PPI) networks were performed to illustrate the interaction in reversely correlated genes. Genes that were closely related to each other were divided into six clusters. Enriched GO terms for the clustered genes are presented.
Figure 8.
Figure 8.
Retinal mitochondria related gene expression in native retina and retinal organoids. The relative expression curves of mitochondria-related genes in mouse native retina (A), mouse retinal organoids (B), human native retina, (C) and human retinal organoids (D) over time were shown. (E) The developmental timeline of retinal mitochondria in mouse and human. Color depth represents the gene relative average expression.

Similar articles

Cited by

References

    1. Swaroop A, Kim D, Forrest D. Transcriptional regulation of photoreceptor development and homeostasis in the mammalian retina. Nat Rev Neurosci. 2010; 11: 563–576. - PMC - PubMed
    1. Hoon M, Okawa H, Della Santina L, Wong RO. Functional architecture of the retina: development and disease. Prog Retin Eye Res. 2014; 42: 44–84. - PMC - PubMed
    1. Bassett EA, Wallace VA. Cell fate determination in the vertebrate retina. Trends Neurosci. 2012; 35: 565–573. - PubMed
    1. Hoshino A, Ratnapriya R, Brooks MJ, et al. .. Molecular anatomy of the developing human retina. Dev Cell. 2017; 43: 763–779. e764. - PMC - PubMed
    1. Aldiri I, Xu B, Wang L, et al. .. The dynamic epigenetic landscape of the retina during development, reprogramming, and tumorigenesis. Neuron. 2017; 94: 550–568. e510. - PMC - PubMed

Publication types

MeSH terms