

Accurate prediction of individual subject identity and task, but not autism diagnosis, from functional connectomes
- PMID: 32150312
- PMCID: PMC7268028
- DOI: 10.1002/hbm.24943
Accurate prediction of individual subject identity and task, but not autism diagnosis, from functional connectomes
Abstract
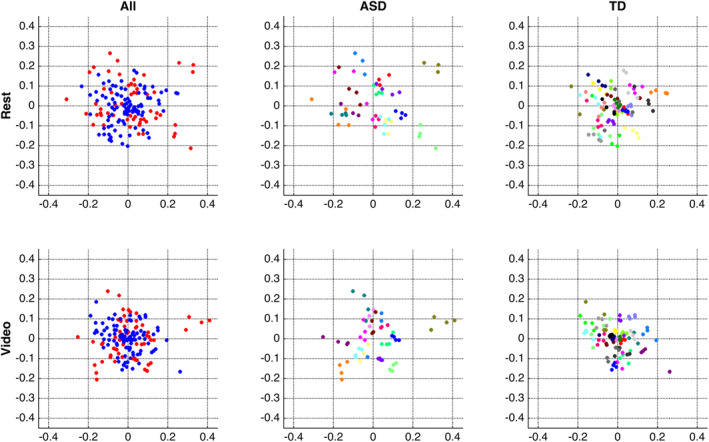
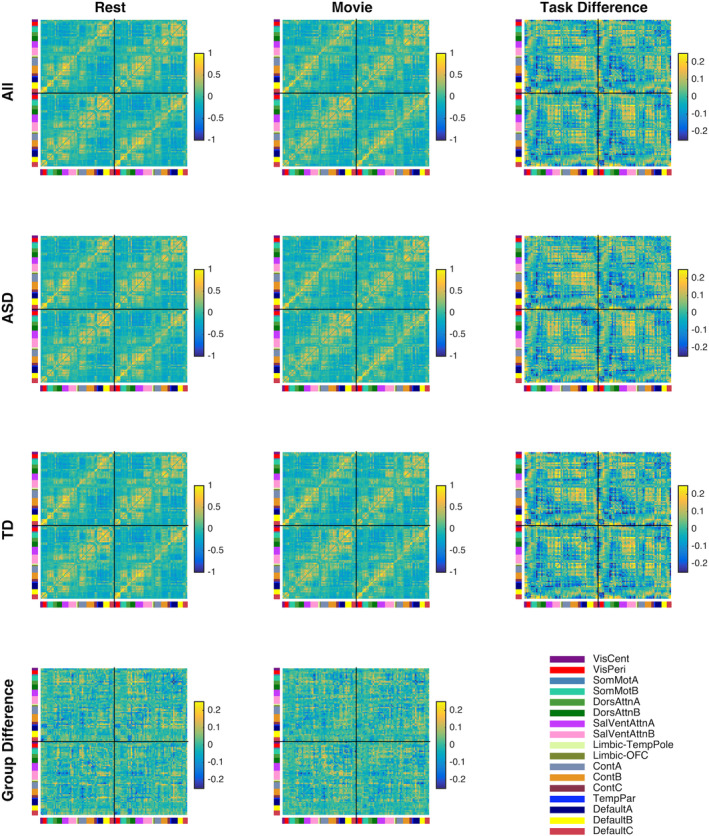
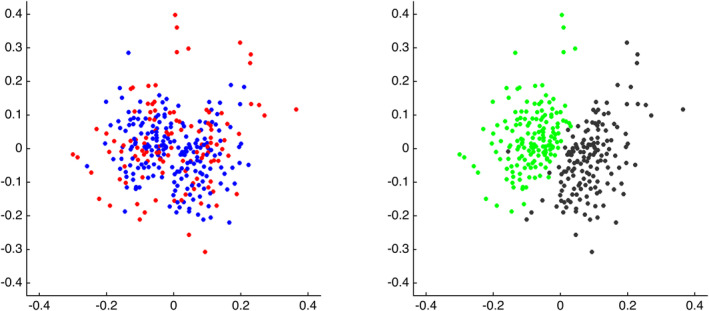
Despite enthusiasm about the potential for using fMRI-based functional connectomes in the development of biomarkers for autism spectrum disorder (ASD), the literature is full of negative findings-failures to distinguish ASD functional connectomes from those of typically developing controls (TD)-and positive findings that are inconsistent across studies. Here, we report on a new study designed to either better differentiate ASD from TD functional connectomes-or, alternatively, to refine our understanding of the factors underlying the current state of affairs. We scanned individuals with ASD and controls both at rest and while watching videos with social content. Using multiband fMRI across repeat sessions, we improved both data quantity and scanning duration by collecting up to 2 hr of data per individual. This is about 50 times the typical number of temporal samples per individual in ASD fcMRI studies. We obtained functional connectomes that were discriminable, allowing for near-perfect individual identification regardless of diagnosis, and equally reliable in both groups. However, contrary to what one might expect, we did not consistently or robustly observe in the ASD group either reductions in similarity to TD functional connectivity (FC) patterns or shared atypical FC patterns. Accordingly, FC-based predictions of diagnosis group achieved accuracy levels around chance. However, using the same approaches to predict scan type (rest vs. video) achieved near-perfect accuracy. Our findings suggest that neither the limitations of resting state as a "task," data resolution, data quantity, or scan duration can be considered solely responsible for failures to differentiate ASD from TD functional connectomes.
Keywords: autism; fcMRI; functional connectivity; individual differences; naturalistic viewing; resting state.
© 2020 The Authors. Human Brain Mapping published by Wiley Periodicals, Inc.
Conflict of interest statement
The authors declare no competing financial interests.
Figures
References
-
- Abraham, A. , Milham, M. P. , Di Martino, A. , Craddock, R. C. , Samaras, D. , Thirion, B. , & Varoquaux, G. (2017). Deriving reproducible biomarkers from multi‐site resting‐state data: An Autism‐based example. NeuroImage, 147, 736–745. - PubMed
-
- Baron‐Cohen, S. , Wheelwright, S. , Skinner, R. , Martin, J. , & Clubley, E. (2001). The autism‐spectrum quotient (AQ): Evidence from asperger syndrome/high‐functioning autism, malesand females, scientists and mathematicians. Journal of Autism and Developmental Disorders, 31(1), 5–17. - PubMed
-
- Betzel, R. F. , Byrge, L., He, Y., Goñi, J., Zuo, X. N., & Sporns, O. (2014). Changes in structural and functional connectivity among resting‐state networks across the human lifespan. Neuroimage, 102, 345–357. - PubMed
