. 2020 Mar 9;14(3):e0008131.
doi: 10.1371/journal.pntd.0008131. eCollection 2020 Mar.

Potential distributions of Bacillus anthracis and Bacillus cereus biovar anthracis causing anthrax in Africa

Affiliations

Potential distributions of Bacillus anthracis and Bacillus cereus biovar anthracis causing anthrax in Africa

Daniel Romero-Alvarez et al. PLoS Negl Trop Dis. .

Abstract

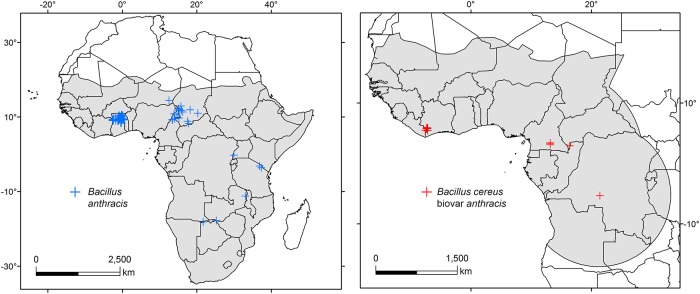
Background: Bacillus cereus biovar anthracis (Bcbva) is an emergent bacterium closely related to Bacillus anthracis, the etiological agent of anthrax. The latter has a worldwide distribution and usually causes infectious disease in mammals associated with savanna ecosystems. Bcbva was identified in humid tropical forests of Côte d'Ivoire in 2001. Here, we characterize the potential geographic distributions of Bcbva in West Africa and B. anthracis in sub-Saharan Africa using an ecological niche modeling approach.

Methodology/principal findings: Georeferenced occurrence data for B. anthracis and Bcbva were obtained from public data repositories and the scientific literature. Combinations of temperature, humidity, vegetation greenness, and soils values served as environmental variables in model calibrations. To predict the potential distribution of suitable environments for each pathogen across the study region, parameter values derived from the median of 10 replicates of the best-performing model for each pathogen were used. We found suitable environments predicted for B. anthracis across areas of confirmed and suspected anthrax activity in sub-Saharan Africa, including an east-west corridor from Ethiopia to Sierra Leone in the Sahel region and multiple areas in eastern, central, and southern Africa. The study area for Bcbva was restricted to West and Central Africa to reflect areas that have likely been accessible to Bcbva by dispersal. Model predicted values indicated potential suitable environments within humid forested environments. Background similarity tests in geographic space indicated statistical support to reject the null hypothesis of similarity when comparing environments associated with B. anthracis to those of Bcbva and when comparing humidity values and soils values individually. We failed to reject the null hypothesis of similarity when comparing environments associated with Bcbva to those of B. anthracis, suggesting that additional investigation is needed to provide a more robust characterization of the Bcbva niche.

Conclusions/significance: This study represents the first time that the environmental and geographic distribution of Bcbva has been mapped. We document likely differences in ecological niche-and consequently in geographic distribution-between Bcbva and typical B. anthracis, and areas of possible co-occurrence between the two. We provide information crucial to guiding and improving monitoring efforts focused on these pathogens.


Conflict of interest statement

The authors have declared that no competing interests exist.

Figures

Fig 1
Fig 1. Occurrence points and calibration areas.
Confirmed records of Bacillus anthracis (blue) and Bcvba (red) with their corresponding calibration areas (gray shading). Maps were developed using shape files of Africa from the public domain repository of Natural Earth (http://www.naturalearthdata.com/) and built with ArcGIS 10.3 (ESRI Redlands, CA, USA).
Fig 2
Fig 2. Model outputs for Bacillus anthracis and Bcbva.
Models using 30 km thinned occurrence data are depicted for B. anthracis (top) and Bcbva (bottom), as maps of continuous suitability (left), uncertainty (center), and binary maps using different thresholds (right). For B. anthracis (top), binary maps were built using thresholds based on minimum training presence (MTP) in yellow, E = 5% in orange, and E = 10% in red. For Bcbva (bottom), binary maps were built using MTP (yellow) and E = 5% (red) thresholds. Maps were developed using shape files of Africa from the public domain repository of Natural Earth (http://www.naturalearthdata.com/) and built with ArcGIS 10.3 (ESRI Redlands, CA, USA).
Fig 3
Fig 3. Overlapping regions for both pathogens.
Bacillus anthracis (light blue) and Bcbva (light orange) suitability as relates to the Bcbva calibration area (orange line) using a minimum training presence threshold among the best performing models. Environments in these areas are characterized via a sample of 5000 points (right panels, same color scheme) considering four individual environmental variables (mean annual temperature, mean annual specific humidity, soil pH, and soil cation exchange capacity) and the first principal component (PC1) of the four environmental dimensions explored in this manuscript (temperature, specific humidity, vegetation greenness or NDVI, and soils). Maps were developed using shapefiles summarizing political borders of Africa from the public domain repository of Natural Earth (http://www.naturalearthdata.com/) and built with QGIS 2.18 ‘Las Palmas’.
Fig 4
Fig 4. Background similarity test between Bacillus anthracis and Bcbva using all environments in geographic space.
The comparison was done using all variables (i.e., 12 PCs) and calculating Schoener’s D statistic. Significant p-values (asterisk) indicate less similarity than expected when comparing to a random distribution.
Fig 5
Fig 5. Background similarity tests between Bacillus anthracis and Bcbva for each individual environmental dimension.
Comparisons were performed using three principal components for each environment, namely temperature, humidity, NDVI, and soils for B. anthracis vs. Bcbva (left) and Bcbva vs. B. anthracis (right). Significant p-values (asterisk) indicate less similarity than expected when comparing to a random distribution.
Fig 6
Fig 6. Kernel density plots around each point of Bacillus anthracis and Bcbva for temperature, humidity, NDVI, and soils depicted in the environmental space.
Principal components one and two (PC1 and PC2) from each dimension were used to depict an environmental space to show regions occupied by B. anthracis (blue) and Bcbva (orange). Pathogens are using non-overlapping regions in each case.

Similar articles

Cited by

References

    1. World Health Organization. Anthrax in humans and animals. 4th ed Geneva: WHO Press; 2008. - PubMed
    1. Turner WC, Kausrud KL, Krishnappa YS, Cromsigt JPGM, Ganz HH, Mapaure I, et al. Fatal attraction: vegetation responses to nutrient inputs attract herbivores to infectious anthrax carcass sites. Proc R Soc B Biol Sci. 2014;281: 20141785. - PMC - PubMed
    1. Turner WC, Kausrud KL, Beyer W, Easterday WR, Barandongo ZR, Blaschke E, et al. Lethal exposure: an integrated approach to pathogen transmission via environmental reservoirs. Sci Rep. 2016;6: 27311 10.1038/srep27311 - DOI - PMC - PubMed
    1. Dragon DC, Rennie RP. The ecology of anthrax spores: tough but not invincible. Can Vet J. 1995;36: 295–301. - PMC - PubMed
    1. Bellan SE, Turnbull PCB, Beyer W, Getz WM. Effects of experimental exclusion of scavengers from carcasses of anthrax-infected herbivores on Bacillus anthracis sporulation, survival, and sistribution. Appl Environ Microbiol. 2013;79: 3756–3761. 10.1128/AEM.00181-13 - DOI - PMC - PubMed