. 2020 Mar 9;16(3):e1008646.
doi: 10.1371/journal.pgen.1008646. eCollection 2020 Mar.

Long transposon-rich centromeres in an oomycete reveal divergence of centromere features in Stramenopila-Alveolata-Rhizaria lineages

Affiliations

Long transposon-rich centromeres in an oomycete reveal divergence of centromere features in Stramenopila-Alveolata-Rhizaria lineages

Yufeng Fang et al. PLoS Genet. .

Abstract

Centromeres are chromosomal regions that serve as platforms for kinetochore assembly and spindle attachments, ensuring accurate chromosome segregation during cell division. Despite functional conservation, centromere DNA sequences are diverse and often repetitive, making them challenging to assemble and identify. Here, we describe centromeres in an oomycete Phytophthora sojae by combining long-read sequencing-based genome assembly and chromatin immunoprecipitation for the centromeric histone CENP-A followed by high-throughput sequencing (ChIP-seq). P. sojae centromeres cluster at a single focus at different life stages and during nuclear division. We report an improved genome assembly of the P. sojae reference strain, which enabled identification of 15 enriched CENP-A binding regions as putative centromeres. By focusing on a subset of these regions, we demonstrate that centromeres in P. sojae are regional, spanning 211 to 356 kb. Most of these regions are transposon-rich, poorly transcribed, and lack the histone modification H3K4me2 but are embedded within regions with the heterochromatin marks H3K9me3 and H3K27me3. Strikingly, we discovered a Copia-like transposon (CoLT) that is highly enriched in the CENP-A chromatin. Similar clustered elements are also found in oomycete relatives of P. sojae, and may be applied as a criterion for prediction of oomycete centromeres. This work reveals a divergence of centromere features in oomycetes as compared to other organisms in the Stramenopila-Alveolata-Rhizaria (SAR) supergroup including diatoms and Plasmodium falciparum that have relatively short and simple regional centromeres. Identification of P. sojae centromeres in turn also advances the genome assembly.


Conflict of interest statement

The authors have declared that no competing interests exist.

Figures

Fig 1
Fig 1. Subcellular localization of CENP-A in P. sojae at different life stages and during vegetative growth.
(A) A schematic showing the generation of GFP-fused CENP-A utilizing CRISPR/Cas9 mediated gene replacement. (B) Subcellular localization of GFP-tagged CENP-A (expressed from the endogenous locus) in P. sojae hyphae, sporangia, and encysted zoospores. (C) Time-lapse images illustrating localization of GFP tagged CENP-A during hyphal growth. Dashed squares denote occurrence of nuclear division. Representative images are shown. Scale bars in all images, 5 μm.
Fig 2
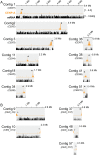
Fig 2. Contigs in the Psojae2019.1 assembly demonstrating CENP-A enrichment based on ChIP-seq.
(A) 10 contigs that harbor fully assembled CENP-A binding sites. (B) Five contigs that possess incompletely assembled CENP-A binding regions. All contigs are drawn to scale and the ruler indicates the length of the contigs. All CENP-A profiles shown were normalized to input DNA. mRNA profiles are shown as log-scales. Solid stars indicate the CENP-A enriched regions within contigs; hollow stars denote broken centromeres at the edge.
Fig 3
Fig 3. A representative Circos visualization comparing a centromere-containing scaffold in Sanger V3 (Scaffold 2) with its corresponding contigs in the Psojae2019.1 assembly.
For the inner circle, track A illustrates assembled contigs (in Psojae2019.1) or scaffold (in P. sojae V3) that are color coded as shown at the top. The locations of centromeres (CENP-A binding regions) are highlighted in yellow. Tracks B-E show the location of other genomic features as given in the key on the bottom. Blue and orange lines in track F link regions with collinearity extending over 2 kb, with orange lines corresponding to inversions. Grey box-shaded centromere-containing regions are magnified for detailed visualization (the two outer arcs).
Fig 4
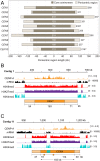
Fig 4. Epigenetic state of P. sojae centromeres.
(A) Schematics showing the P. sojae core centromeres (CENP-A binding regions) and the pericentric regions of various lengths. Dark and light grey bars indicate core centromeric and pericentric regions. Numbers at the center indicate the size of core centromeres; Numbers on the right denote the full-length of the centromeres (a combination of core centromere and pericentromeric region). The right pericentric region of CEN5 and the left pericentric region of CEN10, indicated by dashed bars, are not fully assembled, and their lengths are labeled with question marks. (B-C) Two centromeres (CEN1 and CEN4) are shown as representatives to compare CENP-A localization to the distributions of modified histones. A 400 kb region harboring the centromeric region is shown for CEN1 and CEN4. Cyan block, a transcriptionally active region (21 kb) that interrupts CEN4. Profiles of CENP-A, H3K9me3, H3K27me3 and H3K4me2 shown were normalized to input. mRNA profiles are shown as log-scales. Orange circles in (C) delimit borders of a CENP-A binding void.
Fig 5
Fig 5. P. sojae centromeres are enriched for a Copia-like transposon (CoLT).
(A) Distribution of transposable elements (TEs) in CEN1. TEs were annotated using a Phytophthora TE library from Repbase [45]. Tracks of different repeat families are color coded. The track “Other TEs” includes all types of TEs beyond Gypsy and Copia. CoLT was composed of three elements annotated in Repbase [45], namely Copia-24_PIT-I, Copia-24_PIT-LTR and Gypsy-P17-PR-I. The profile of CENP-A shown was normalized to input. The mRNA track is shown as log-scales and used to define the boundary of pericentric heterochromatin. (B) Location of CoLT elements across all of the Psojae2019.1 contigs. (C) Diagram showing the domain structure of a representative full-length CoLT sequence (see S3 File). The coding domain featured as Copia superfamily of retrotransposons, which consists of capsid protein (GAG), Gag-pre-integrase (PR), integrase (INT), reverse transcriptase (RT), and RNase H (RH) domains, and diverges from the Gypsy superfamily in the order of the RT and INT domains in their POL genes [86].
Fig 6
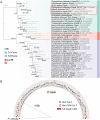
Fig 6. Phylogenetic analyses of CoLT.
(A) Maximum-likelihood phylogeny of different retroelements. Protein sequences of the reverse transcriptase (RT) domains were used to construct the tree [87] (see S4A File for the complete DNA and protein sequences). The tree was rooted in the midpoint and branch support values (> 50%) shown at the three nodes were determined by 10,000 replicates of both ultrafast bootstrap approximation (UFBoot) and the Shimodaira-Hasegawa approximate likelihood ratio test (SH-aLRT). (B) Maximum-likelihood phylogeny of full-length CoLT elements identified in the Psojae2010.1 genome assembly. CoLT copies located inside and outside of centromeres are denoted by blue and red circles. CoLT elements with full-length coding sequences (CDS) are depicted as filled circles. A CoLT sequence identified in P. citricola served as an outgroup. See S4B File for the CoLT copies used for the phylogenetic analysis.
Fig 7
Fig 7. Genomic distribution of CoLT in the Bremia lactucae genome.
(A) Location of CoLT elements across all B. lactucae scaffolds >100 kb. For ease of analysis, scaffolds in the B. lactucae assembly were sorted and re-named based on sizes (large to small). See S5 File for the original scaffold names. Regions underlined by green lines indicate that both sides of the CoLT clusters are syntenic with the regions surrounding the P. sojae centromeres. Regions underlined by blue indicate only one side of the CoLT clusters was found to be syntenic with P. sojae centromere flanking sequences. (B) A representative Circos plot comparing a B. lactucae scaffold that has clustered CoLT elements (Scaffold 2)with the corresponding Psojae2019.1 contigs. The outer track illustrates the assembled scaffold (in the sorted B. lactucae assembly) or contigs (in Psojae2019.1), which is color coded as shown at the top. Names of contigs possessing P. sojae centromeres are enclosed in circles. Yellow regions on the outer tracks indicate the locations of centromeres (CENP-A binding regions). Blue and orange lines in track F link regions with synteny extending over 2 kb, with orange lines corresponding to inversions. Two CoLT clusters are identified in the B. lactucae Scaffold 2 (s2; original scaffold, SHOA01000004.1), which are indicated by arrowheads of different colors.
Fig 8
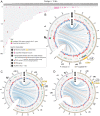
Fig 8. Genomic distribution of CoLT in the Phytophthora citricola genome.
(A) Location of CoLT across all P. citricola contigs >100 kb. (B-D) Circos plots comparing three P. citricola contigs that have CoLT clusters with the corresponding Psojae2019.1 contigs. In each panel, the outer track (bars) illustrates the contigs in the P. citricola or the Psojae2019.1 genome assemblies, which is color coded as shown below the Circos plot in panel B. Yellow regions indicate the locations of centromeres (CENP-A binding regions). Names of contigs harboring P. sojae centromeres are enclosed in circles. Blue and orange lines in track F link regions with synteny extending over 2 kb, with orange lines corresponding to inversions. CoLT clusters present in the P. citricola contigs are indicated by arrowheads. The flanking sequences of each CoLT cluster are syntenic with the regions surrounding the P. sojae centromere.
Fig 9
Fig 9. Diversity of centromere features within the Stramenopila-Alveolata-Rhizaria (SAR) supergroup.
Simplified schematics (not to scale) showing the structures, epigenetic modifications, sizes and compositions of reported centromeres across the SAR lineages. Asterisk, epigenetic state was not examined in the diatom centromeric regions; however, several AT-rich DNA sequences can be employed for episome maintenance, suggesting diatom centromere might not be epigenetically dependent. The histone modification H3K27me3 was only tested in P. sojae. Phylogenetic tree was constructed using TimeTree [88]. Homo sapiens, Arabidopsis thaliana and Neurospora crassa were used as representatives of animals, plants and fungi for the phylogenetic analysis, and are used as outgroups illustrating the evolutionary status of the SAR supergroup.

Similar articles

Cited by

References

    1. Kursel LE, Malik HS. Centromeres. Curr Biol. 2016;26(12):R487–R90. Epub 2016/06/22. 10.1016/j.cub.2016.05.031 . - DOI - PubMed
    1. Stimpson KM, Sullivan BA. Epigenomics of centromere assembly and function. Curr Opin Cell Biol. 2010;22(6):772–80. Epub 2010/08/03. 10.1016/j.ceb.2010.07.002 . - DOI - PubMed
    1. Buscaino A, Allshire R, Pidoux A. Building centromeres: home sweet home or a nomadic existence? Curr Opin Genet Dev. 2010;20(2):118–26. Epub 2010/03/09. 10.1016/j.gde.2010.01.006 . - DOI - PubMed
    1. Wang N, Dawe RK. Centromere size and its relationship to haploid formation in plants. Mol Plant. 2018;11(3):398–406. Epub 2017/12/27. 10.1016/j.molp.2017.12.009 . - DOI - PubMed
    1. Black BE, Foltz DR, Chakravarthy S, Luger K, Woods VL Jr, Cleveland DW. Structural determinants for generating centromeric chromatin. Nature. 2004;430(6999):578–82. Epub 2004/07/30. 10.1038/nature02766 . - DOI - PubMed

Publication types