

Cue-dependent effects of VR experience on motion-in-depth sensitivity
- PMID: 32150569
- PMCID: PMC7062262
- DOI: 10.1371/journal.pone.0229929
Cue-dependent effects of VR experience on motion-in-depth sensitivity
Abstract
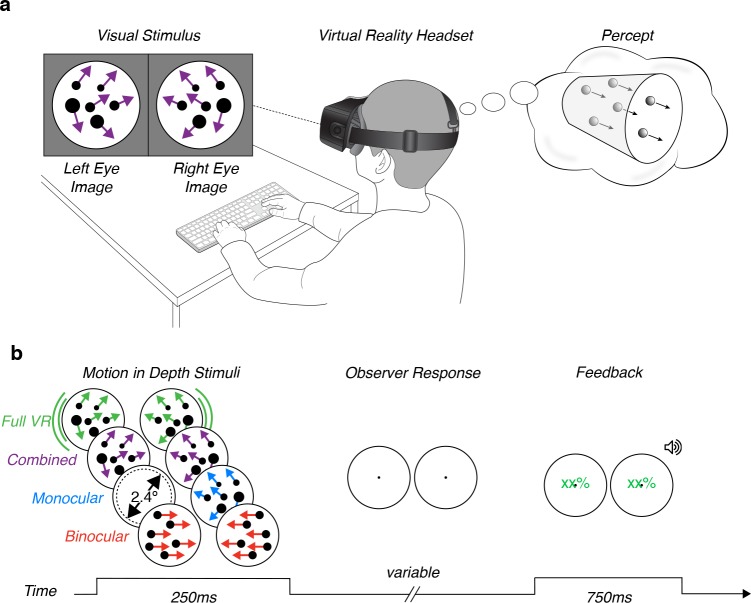
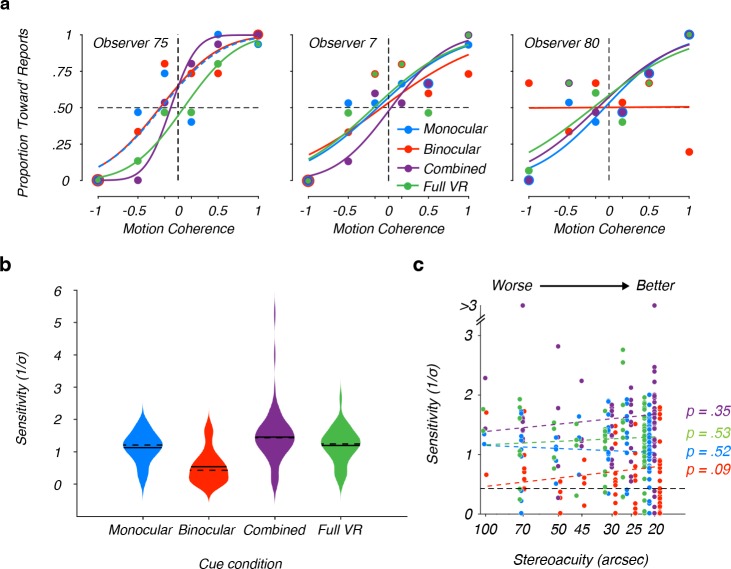
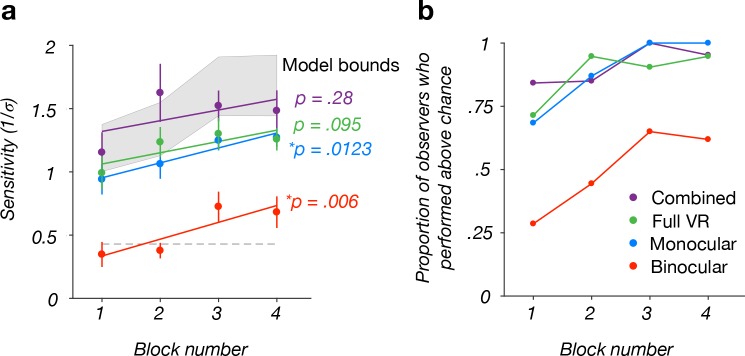
The visual system exploits multiple signals, including monocular and binocular cues, to determine the motion of objects through depth. In the laboratory, sensitivity to different three-dimensional (3D) motion cues varies across observers and is often weak for binocular cues. However, laboratory assessments may reflect factors beyond inherent perceptual sensitivity. For example, the appearance of weak binocular sensitivity may relate to extensive prior experience with two-dimensional (2D) displays in which binocular cues are not informative. Here we evaluated the impact of experience on motion-in-depth (MID) sensitivity in a virtual reality (VR) environment. We tested a large cohort of observers who reported having no prior VR experience and found that binocular cue sensitivity was substantially weaker than monocular cue sensitivity. As expected, sensitivity was greater when monocular and binocular cues were presented together than in isolation. Surprisingly, the addition of motion parallax signals appeared to cause observers to rely almost exclusively on monocular cues. As observers gained experience in the VR task, sensitivity to monocular and binocular cues increased. Notably, most observers were unable to distinguish the direction of MID based on binocular cues above chance level when tested early in the experiment, whereas most showed statistically significant sensitivity to binocular cues when tested late in the experiment. This result suggests that observers may discount binocular cues when they are first encountered in a VR environment. Laboratory assessments may thus underestimate the sensitivity of inexperienced observers to MID, especially for binocular cues.
Conflict of interest statement
The authors have declared that no competing interests exist. Support from these funders does not alter our adherence to PLOS ONE policies on sharing data and materials.
Figures
Similar articles
-
Contributions of binocular and monocular cues to motion-in-depth perception.J Vis. 2019 Mar 1;19(3):2. doi: 10.1167/19.3.2. J Vis. 2019. PMID: 30836382 Free PMC article.
-
Cue vetoing in depth estimation: Physical and virtual stimuli.Vision Res. 2021 Nov;188:51-64. doi: 10.1016/j.visres.2021.07.003. Epub 2021 Jul 18. Vision Res. 2021. PMID: 34289419
-
Depth Perception Based on the Interaction of Binocular Disparity and Motion Parallax Cues in Three-Dimensional Space.Sensors (Basel). 2025 May 17;25(10):3171. doi: 10.3390/s25103171. Sensors (Basel). 2025. PMID: 40431963 Free PMC article. Review.
-
Speed discrimination of motion-in-depth using binocular cues.Vision Res. 1995 Apr;35(7):885-96. doi: 10.1016/0042-6989(94)00194-q. Vision Res. 1995. PMID: 7762146
-
The neural basis of depth perception from motion parallax.Philos Trans R Soc Lond B Biol Sci. 2016 Jun 19;371(1697):20150256. doi: 10.1098/rstb.2015.0256. Philos Trans R Soc Lond B Biol Sci. 2016. PMID: 27269599 Free PMC article. Review.
Cited by
-
Motion-in-depth effects on interceptive timing errors in an immersive environment.Sci Rep. 2021 Nov 9;11(1):21961. doi: 10.1038/s41598-021-01397-x. Sci Rep. 2021. PMID: 34754000 Free PMC article.
-
Perception and Motion in Real and Virtual Environments: A Narrative Review of Autism Spectrum Disorders.Front Psychol. 2021 Jul 12;12:708229. doi: 10.3389/fpsyg.2021.708229. eCollection 2021. Front Psychol. 2021. PMID: 34322072 Free PMC article. Review.
-
Walking humans and running mice: perception and neural encoding of optic flow during self-motion.Philos Trans R Soc Lond B Biol Sci. 2023 Jan 30;378(1869):20210450. doi: 10.1098/rstb.2021.0450. Epub 2022 Dec 13. Philos Trans R Soc Lond B Biol Sci. 2023. PMID: 36511417 Free PMC article. Review.
-
Perspective Cues Make Eye-specific Contributions to 3-D Motion Perception.J Cogn Neurosci. 2021 Dec 6;34(1):192-208. doi: 10.1162/jocn_a_01781. J Cogn Neurosci. 2021. PMID: 34813655 Free PMC article.
-
Hierarchical computation of 3D motion across macaque areas MT and FST.Cell Rep. 2023 Dec 26;42(12):113524. doi: 10.1016/j.celrep.2023.113524. Epub 2023 Dec 6. Cell Rep. 2023. PMID: 38064337 Free PMC article.
References
-
- Hillis JM, Watt SJ, Landy MS, Banks MS. Slant from texture and disparity cues: Optimal cue combination. J Vision. 2004;4: 967–992. - PubMed
Publication types
MeSH terms
Grants and funding
LinkOut - more resources
Full Text Sources
Research Materials
