. 2020 Mar 9;16(3):e1008344.
doi: 10.1371/journal.ppat.1008344. eCollection 2020 Mar.

Repurposing the Streptococcus mutans CRISPR-Cas9 System to Understand Essential Gene Function

Affiliations

Repurposing the Streptococcus mutans CRISPR-Cas9 System to Understand Essential Gene Function

Robert C Shields et al. PLoS Pathog. .

Abstract

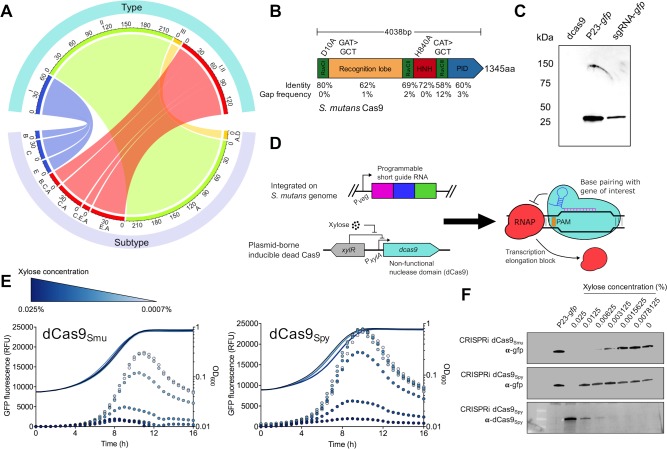
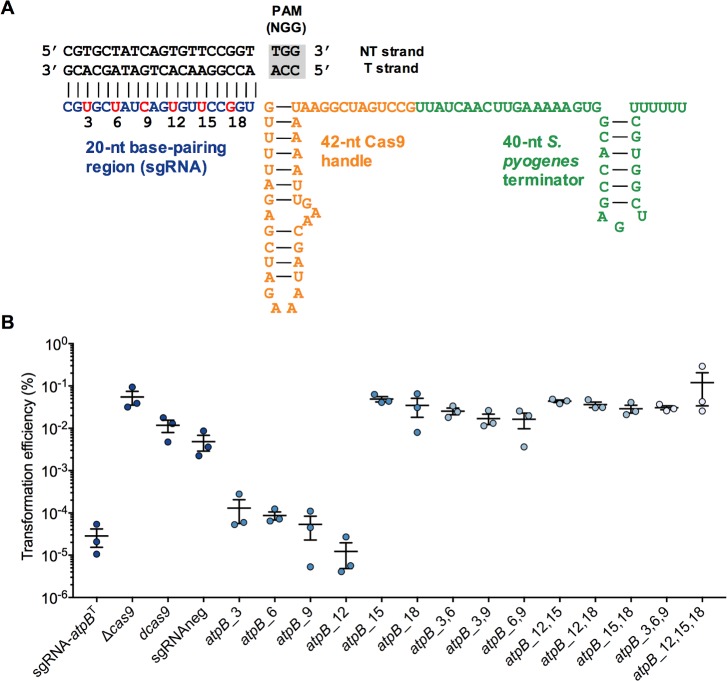
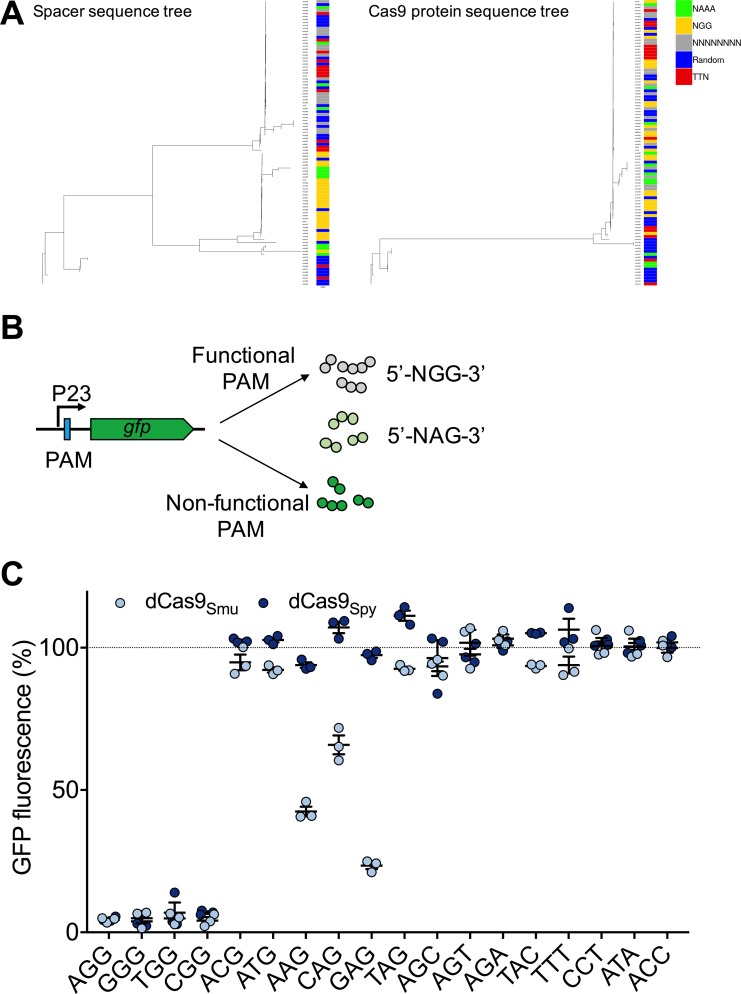
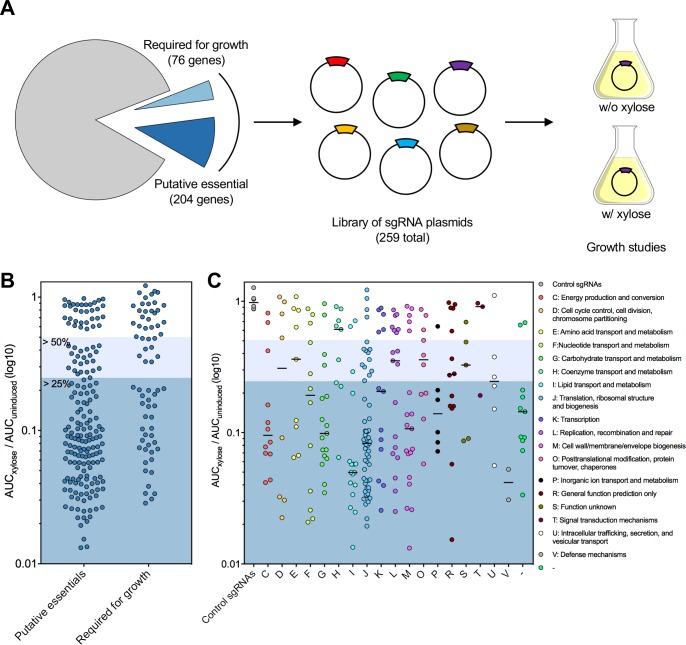
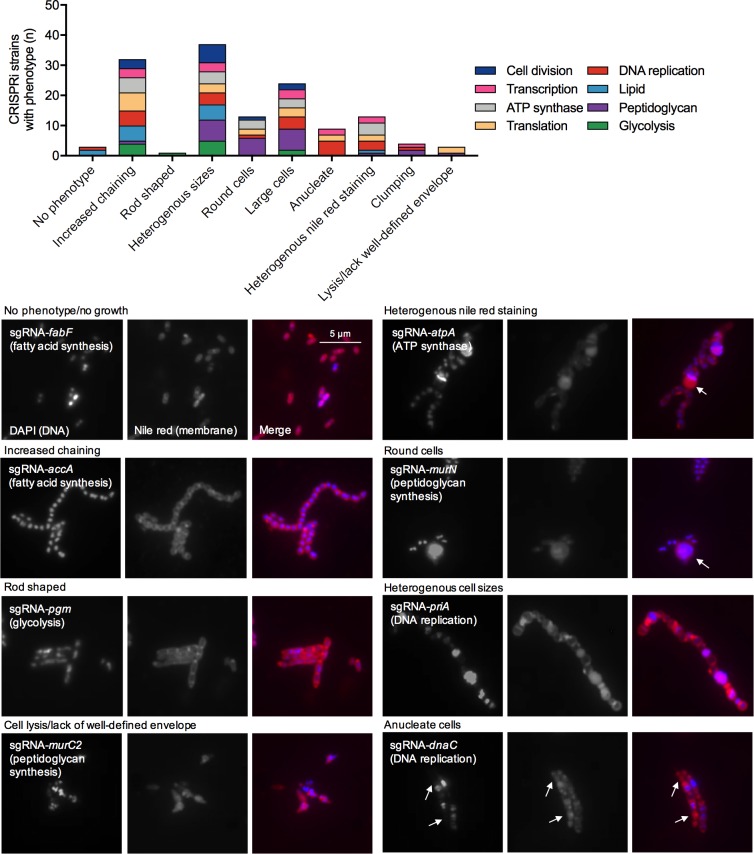
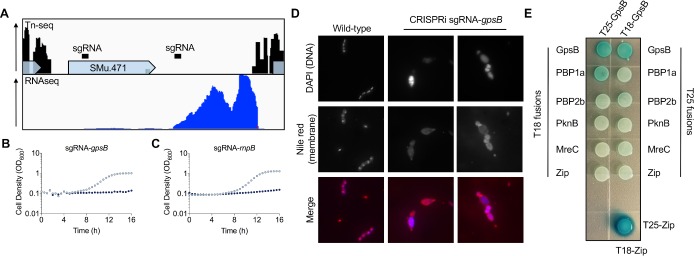
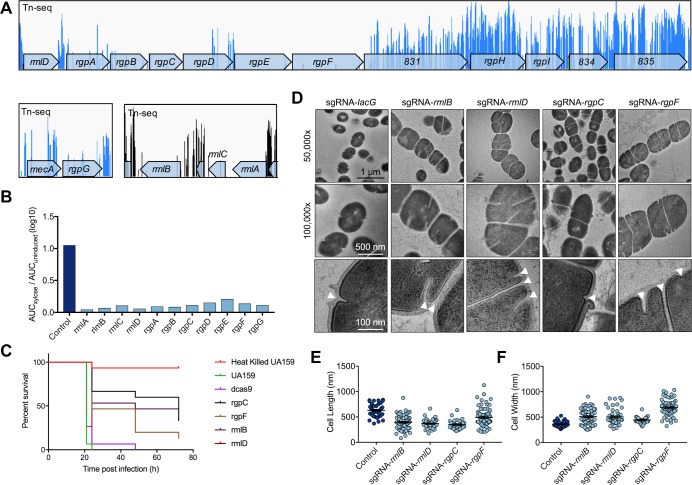
A recent genome-wide screen identified ~300 essential or growth-supporting genes in the dental caries pathogen Streptococcus mutans. To be able to study these genes, we built a CRISPR interference tool around the Cas9 nuclease (Cas9Smu) encoded in the S. mutans UA159 genome. Using a xylose-inducible dead Cas9Smu with a constitutively active single-guide RNA (sgRNA), we observed titratable repression of GFP fluorescence that compared favorably to that of Streptococcus pyogenes dCas9 (Cas9Spy). We then investigated sgRNA specificity and proto-spacer adjacent motif (PAM) requirements. Interference by sgRNAs did not occur with double or triple base-pair mutations, or if single base-pair mutations were in the 3' end of the sgRNA. Bioinformatic analysis of >450 S. mutans genomes allied with in vivo assays revealed a similar PAM recognition sequence as Cas9Spy. Next, we created a comprehensive library of sgRNA plasmids that were directed at essential and growth-supporting genes. We discovered growth defects for 77% of the CRISPRi strains expressing sgRNAs. Phenotypes of CRISPRi strains, across several biological pathways, were assessed using fluorescence microscopy. A variety of cell structure anomalies were observed, including segregational instability of the chromosome, enlarged cells, and ovococci-to-rod shape transitions. CRISPRi was also employed to observe how silencing of cell wall glycopolysaccharide biosynthesis (rhamnose-glucose polysaccharide, RGP) affected both cell division and pathogenesis in a wax worm model. The CRISPRi tool and sgRNA library are valuable resources for characterizing essential genes in S. mutans, some of which could prove to be promising therapeutic targets.


Conflict of interest statement

The authors have declared that no competing interests exist.

Figures

Fig 1
Fig 1. Design of an inducible CRISPRi gene-silencing system for S. mutans.
(A) Distribution of CRISPR-Cas systems in S. mutans by type (top half) and subtype (bottom half). For example, 67 S. mutans strains contain Type I systems (blue), and the subtypes of this system are B, C, and E (I-C is the most common). The numbers on the exterior of the plot denote the number of S. mutans strains that possess a certain CRISPR-Cas system. (B) Diagram of the Cas9 protein of S. mutans UA159 showing domains. The two conserved amino acids required for nuclease activity in the S. pyogenes Cas9 protein that were mutated to create the S. mutans dCas9 protein are indicated. Each domain was compared with S. pyogenes Cas9 for percentage amino acid identity. (C) Gene-silencing activity of endogenous dCas9Smu was assessed by expressing an sgRNA with complementarity to a chromosomally integrated gfp gene and comparing GFP protein levels using Western blotting (sgRNA-gfp). Also shown is a negative control, dcas9 without gfp, and a positive control strain that constitutively expreses the gfp gene from the P23 promoter (see text for details). (D) Overview of the CRISPRi system engineered for S. mutans, which consists of two primary elements, a chromosomally located sgRNA and a plasmid-borne inducible dead Cas9. Combined, these two elements can block gene transcription as shown on the right. (E) Comparison of dCas9Smu (left) and dCas9Spy (right) gfp gene silencing activity using real-time fluorescence monitoring. Fluorescence readings are shown as dots, and cell density (OD600) readings as lines. As the xylose concentration was decreased, data points change from a dark to a light blue color. (F) Comparison of dCas9Smu (top panel) and dCas9Spy (middle panel) gfp gene silencing activity with Western blotting as as a function of xylose concentration. The bottom panel is a Western blot against the xylose-inducible dCas9Spy; as this antibody detected dCas9Spy, but not dCas9Smu. Western images are representative of three independent replicates.
Fig 2
Fig 2. Determining guide RNA specificity of Cas9Smu.
(A) Diagram of the sgRNA for atpB and the mutagenesis strategy. Positions 3, 6, 9, 12, 15 and 18 of the sgRNA were mutated (including in pairs or triplets) as a way of investigating sgRNA specificity (see text for additional details). (B) Plasmid interference assay of wild-type and mutated sgRNA-atpB plasmids, with Δcas9, dcas9 and sgRNAneg serving as controls (for no plasmid interference). If the plasmid interfered with S. mutans atpB expression, a lower transformation efficiency would be expected.
Fig 3
Fig 3. Investigating the proto-spacer adjacent motif (PAM) requirements of Cas9Smu.
(A) Phylogenetic relatedness of extracted CRISPR-Cas9 spacer sequences (left) and Cas9 protein sequences (right). Consensus PAM sequences were built from spacer sequences and are available in S3 Fig in S1 File. A key describing the colors chosen for consensus PAM sequences is shown on the far right. (B) To determine the optimal PAM sequence for dCas9Smu, different PAM sequences were inserted into between the P23 promoter and gfp gene. (C) The functionality of various PAM sequences were compared by measuring CRISPRi repression of GFP fluorescence for both S. pyogenes and S. mutans Cas9. Repression was calculated as a percentage of maximal fluorescence without exogenous xylose compared to fluorescence with 0.1% xylose added. Bars show the average and standard deviation, and light blue dots are the individual values, obtained using the dCas9Smu construct, whereas the dark blue dots show data obtained using dCas9Spy. Maximal repression was measured with a 5’-NGG-3’ PAM, with moderate repression for some 5’-NAG-3’ PAMs.
Fig 4
Fig 4. High-throughput growth analysis of a comprehensive library of sgRNAs targeting essential and growth supporting genes.
(A) Overview of the CRISPRi growth study that included generating sgRNAs against >250 essential or growth-supporting genes. Growth analysis of CRISPRi strains (B) whether putative essential or required for growth and (C) sorted for physiological functions by Clusters of Orthologous Groups. CRISPRi strains were cultured in the presence or absence of xylose and the area under the curve (AUC) was calculated for each condition. Growth phenotypes were categorized according to the ratio of AUCxylose to AUCuninduced (the lower the number the stronger the growth defect).
Fig 5
Fig 5. Microscopic analysis of the morphological defects caused by CRISPRi essential gene depletion.
(A) CRISPRi strains, by functional pathway, were grouped according to cell morphology phenotypes. Strains with depleted essential genes can have more than one morphological defect (e.g. increased cell chaining and heterogeneous sizes). (B) Representative micrographs for several of the cell morphology phenotypes that were observed are shown. Additional microscopy across all the pathways investigated can be found in S5–S12 Figs in S1 File. For sgRNA-atpA the arrow shows an area of increased nile red staining compared to other cells. The large round cells observed when silencing peptidoglycan biosynthesis is depicted with the sgRNA-murN micrograph. Arrows indicate potential anucleate cells when targeting the DNA replication-related gene dnaC.
Fig 6
Fig 6. Identification of the essential peptidoglycan synthesis regulator GpsB in S. mutans.
(A) Distribution of Tn-seq reads (top panel) within SMu.471 and the downstream intergenic region. Each peak corresponds to a transposon insertion with a lack of peaks within a gene representative of an essential gene (e.g. SMu.471). RNA sequencing reads (bottom panel) obtained from mid-log S. mutans cells grown in FMC-maltose. High levels of transcription are evident in the region downstream of SMu.471, which is likely to be the RNA component of RNase P (rnpB). CRISPRi growth phenotypes of silenced gpsB (SMu.471; B) and rnpB (C). Strains were cultured in FMC-maltose without (light blue dots) or with (dark blue dots) 0.1% xylose. (D) Microscopic analysis of a CRISPRi strain with depleted levels of gpsB. Strains were cultured overnight in FMC-maltose containing 0.1% xylose, stained with DNA and membrane staining dyes, and then imaged with fluorescence microscopy. Images are representative of five independent replicates. (E) Bacterial two-hybrid screening to test interactions between GpsB and putative interaction partners. Interactions were tested using constructs cloned into two plasmids pKT25 and pUT18C (T18 and T25 fusions). A positive control is shown on the bottom right (T25-zip with T18-zip). GpsB interacts with itself and has a weak interaction with PBP1a as shown by blue colonies (β-galactosidase activity has been restored by interactions between the two proteins; see S1 File for a description of the methodology).
Fig 7
Fig 7. Rhamnose-glucose polysaccharide biosynthesis genes are required for growth, pathogenesis and correct cell division of S. mutans.
(A) Distribution of Tn-seq reads within genes that function in RGP biosynthesis (rmlA-rmlC, rgpG, and rmlD-rgpF; SMu.831-835 reside in the operon that starts with rmlD). Each peak corresponds to a transposon insertion with a lack of peaks within a gene representative of an essential gene (e.g. rmlA or rgpE). (B) Growth phenotypes of silenced RGP biosynthesis genes compared to a control strain (sgRNA-lacG). (C) Pathogenesis phenotypes of silenced RGP biosynthesis genes (rmlB, rmlD, rgpC, and rgpF) in a Galleria mellonella infection model. Heat killed UA159 served as a negative control, and wild-type UA159 and dcas9 absent sgRNA as positive controls. (D) Electron micrographs of CRISPRi strains targeting the same genes investigated in the pathogenesis model. Arrowheads point to putative division septa. Fluorescence microscopy images and growth curves for CRISPRi strains for all of the genes involved in this pathway can be found in S13 Fig in S1 File. Cell length (E) and width (F) measurements from TEM micrographs using ImageJ.

Similar articles

Cited by

References

    1. Krzyściak W, Pluskwa KK, Jurczak A, Kościelniak D. The pathogenicity of the Streptococcus genus. Eur J Clin Microbiol Infect Dis. 2013;32: 1361–1376. 10.1007/s10096-013-1914-9 - DOI - PMC - PubMed
    1. Dewhirst FE, Chen T, Izard J, Paster BJ, Tanner ACR, Yu W-H, et al. The human oral microbiome. J Bacteriol. 2010;192: 5002–17. 10.1128/JB.00542-10 - DOI - PMC - PubMed
    1. Pitts NB, Zero DT, Marsh PD, Ekstrand K, Weintraub JA, Ramos-Gomez F, et al. Dental caries. Nat Rev Dis Primer. 2017;3: 17030 10.1038/nrdp.2017.30 - DOI - PubMed
    1. Lemos JA, Quivey RG, Koo H, Abranches J. Streptococcus mutans: a new Gram-positive paradigm? Microbiology. 2013;159: 436–45. 10.1099/mic.0.066134-0 - DOI - PMC - PubMed
    1. Nomura R, Nakano K, Nemoto H, Fujita K, Inagaki S, Takahashi T, et al. Isolation and characterization of Streptococcus mutans in heart valve and dental plaque specimens from a patient with infective endocarditis. J Med Microbiol. 2006;55: 1135–1140. 10.1099/jmm.0.46609-0 - DOI - PubMed

Publication types

MeSH terms

Substances