

Apparent size and morphology of bacterial microcompartments varies with technique
- PMID: 32150579
- PMCID: PMC7062276
- DOI: 10.1371/journal.pone.0226395
Apparent size and morphology of bacterial microcompartments varies with technique
Abstract
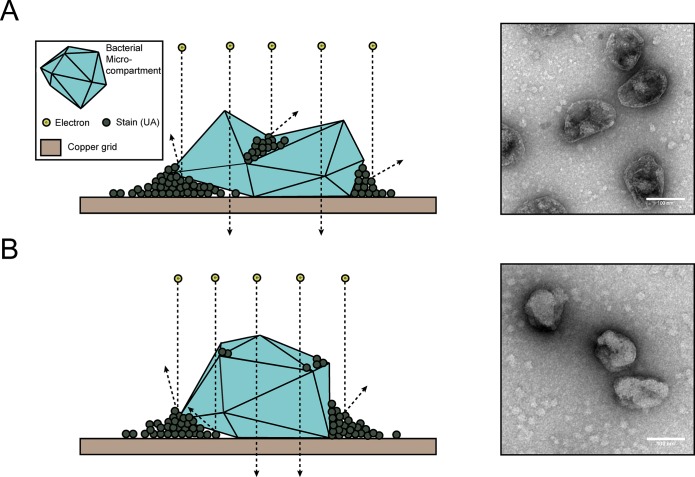
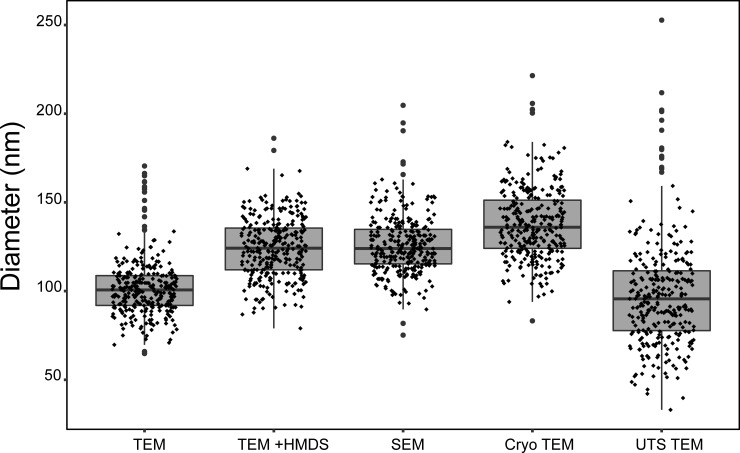
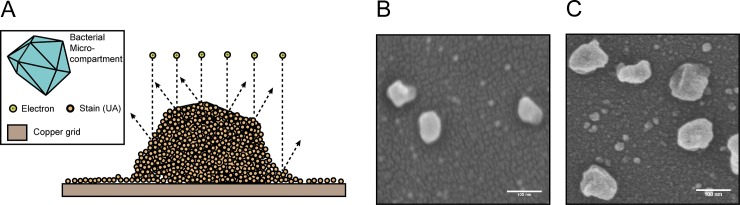
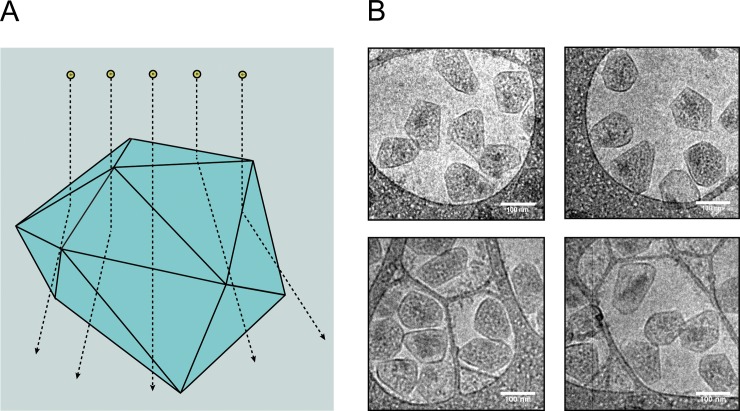
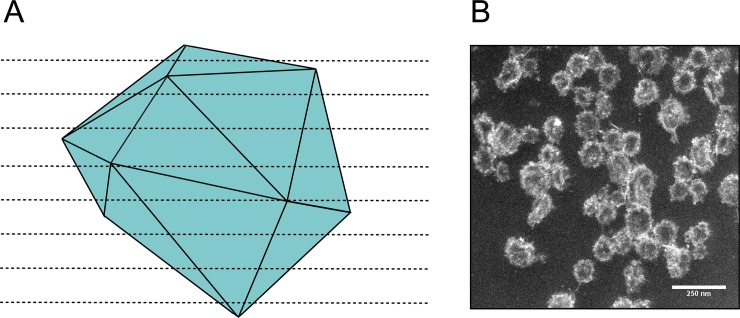
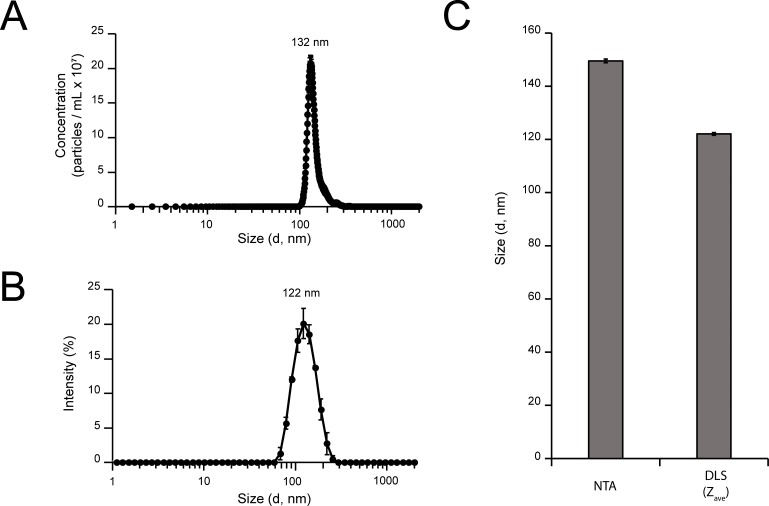
Bacterial microcompartments (MCPs) are protein-based organelles that encapsulate metabolic pathways. Metabolic engineers have recently sought to repurpose MCPs to encapsulate heterologous pathways to increase flux through pathways of interest. As MCP engineering becomes more common, standardized methods for analyzing changes to MCPs and interpreting results across studies will become increasingly important. In this study, we demonstrate that different imaging techniques yield variations in the apparent size of purified MCPs from Salmonella enterica serovar Typhimurium LT2, likely due to variations in sample preparation methods. We provide guidelines for preparing samples for MCP imaging and outline expected variations in apparent size and morphology between methods. With this report we aim to establish an aid for comparing results across studies.
Conflict of interest statement
The authors have declared that no competing interests exist.
Figures
Similar articles
-
The PduM protein is a structural component of the microcompartments involved in coenzyme B(12)-dependent 1,2-propanediol degradation by Salmonella enterica.J Bacteriol. 2012 Apr;194(8):1912-8. doi: 10.1128/JB.06529-11. Epub 2012 Feb 17. J Bacteriol. 2012. PMID: 22343294 Free PMC article.
-
Linking the Salmonella enterica 1,2-Propanediol Utilization Bacterial Microcompartment Shell to the Enzymatic Core via the Shell Protein PduB.J Bacteriol. 2022 Sep 20;204(9):e0057621. doi: 10.1128/jb.00576-21. Epub 2022 May 16. J Bacteriol. 2022. PMID: 35575582 Free PMC article.
-
In Salmonella enterica, Ethanolamine Utilization Is Repressed by 1,2-Propanediol To Prevent Detrimental Mixing of Components of Two Different Bacterial Microcompartments.J Bacteriol. 2015 Jul;197(14):2412-21. doi: 10.1128/JB.00215-15. Epub 2015 May 11. J Bacteriol. 2015. PMID: 25962913 Free PMC article.
-
The challenge of relating gene expression to the virulence of Salmonella enterica serovar Typhimurium.Curr Opin Biotechnol. 2011 Apr;22(2):200-10. doi: 10.1016/j.copbio.2011.02.007. Epub 2011 Mar 22. Curr Opin Biotechnol. 2011. PMID: 21388802 Review.
-
Prokaryotic Organelles: Bacterial Microcompartments in E. coli and Salmonella.EcoSal Plus. 2020 Oct;9(1):10.1128/ecosalplus.ESP-0025-2019. doi: 10.1128/ecosalplus.ESP-0025-2019. EcoSal Plus. 2020. PMID: 33030141 Free PMC article. Review.
Cited by
-
Making the Most of your Electrons: Challenges and Opportunities in Characterizing Hybrid Interfaces with STEM.Mater Today (Kidlington). 2021 Nov;50:100-115. doi: 10.1016/j.mattod.2021.05.006. Epub 2021 Jun 19. Mater Today (Kidlington). 2021. PMID: 35241968 Free PMC article.
-
Mechanisms of Scaffold-Mediated Microcompartment Assembly and Size Control.ACS Nano. 2021 Mar 23;15(3):4197-4212. doi: 10.1021/acsnano.0c05715. Epub 2021 Mar 8. ACS Nano. 2021. PMID: 33683101 Free PMC article.
-
Variety of size and form of GRM2 bacterial microcompartment particles.Protein Sci. 2021 May;30(5):1035-1043. doi: 10.1002/pro.4069. Epub 2021 Apr 2. Protein Sci. 2021. PMID: 33763934 Free PMC article.
-
Chemical probing provides insight into the native assembly state of a bacterial microcompartment.Structure. 2022 Apr 7;30(4):537-550.e5. doi: 10.1016/j.str.2022.02.002. Epub 2022 Feb 24. Structure. 2022. PMID: 35216657 Free PMC article.
-
Vertex protein PduN tunes encapsulated pathway performance by dictating bacterial metabolosome morphology.Nat Commun. 2022 Jun 29;13(1):3746. doi: 10.1038/s41467-022-31279-3. Nat Commun. 2022. PMID: 35768404 Free PMC article.
References
Publication types
MeSH terms
Grants and funding
LinkOut - more resources
Full Text Sources
Research Materials
Miscellaneous
