. 2020 Mar 9;16(3):e1008282.
doi: 10.1371/journal.ppat.1008282. eCollection 2020 Mar.

Protein Kinase C subtype δ interacts with Venezuelan equine encephalitis virus capsid protein and regulates viral RNA binding through modulation of capsid phosphorylation

Affiliations

Protein Kinase C subtype δ interacts with Venezuelan equine encephalitis virus capsid protein and regulates viral RNA binding through modulation of capsid phosphorylation

Brian D Carey et al. PLoS Pathog. .

Abstract

Protein phosphorylation plays an important role during the life cycle of many viruses. Venezuelan equine encephalitis virus (VEEV) capsid protein has recently been shown to be phosphorylated at four residues. Here those studies are extended to determine the kinase responsible for phosphorylation and the importance of capsid phosphorylation during the viral life cycle. Phosphorylation site prediction software suggests that Protein Kinase C (PKC) is responsible for phosphorylation of VEEV capsid. VEEV capsid co-immunoprecipitated with PKCδ, but not other PKC isoforms and siRNA knockdown of PKCδ caused a decrease in viral replication. Furthermore, knockdown of PKCδ by siRNA decreased capsid phosphorylation. A virus with capsid phosphorylation sites mutated to alanine (VEEV CPD) displayed a lower genomic copy to pfu ratio than the parental virus; suggesting more efficient viral assembly and more infectious particles being released. RNA:capsid binding was significantly increased in the mutant virus, confirming these results. Finally, VEEV CPD is attenuated in a mouse model of infection, with mice showing increased survival and decreased clinical signs as compared to mice infected with the parental virus. Collectively our data support a model in which PKCδ mediated capsid phosphorylation regulates viral RNA binding and assembly, significantly impacting viral pathogenesis.


Conflict of interest statement

The authors have declared that no competing interests exist.

Figures
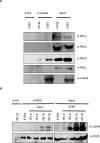
Fig 1
Fig 1. VEEV capsid co-immunoprecipitates with PKCδ, but not other PKC family members.
A) Vero cells were mock-infected or infected with VEEV TC-83 (MOI of 1.0) for 24 hours. Cells were lysed and 1 μg of either α-HA or α-capsid antibody was added to 1 mg of protein lysate. Protein complexes were bound to Protein G Dynabeads, and samples were run on SDS-PAGE and western blot analysis was performed for VEEV capsid and each PKC isoform shown. Images are representative of 3 biological replicates. B) Vero cells were mock-infected or infected with VEEV TC-83 (MOI of 1.0) and collected at the indicated time points. Cells were lysed and 1 μg of either α-HA or α-PKCδ antibody was added to 1 mg of protein lysate. Protein complexes were bound to Protein G Dynabeads, samples were run on SDS-PAGE and western blot analysis was performed for capsid and PKCδ. Images are representative of 3 biological replicates.
Fig 2
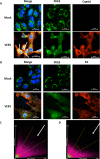
Fig 2. PKCδ co-localizes with VEEV capsid but not VEEV E2.
A) Representative confocal microscopy images of mock-infected cells or cells infected with VEEV TC-83 (MOI 1.0) for 16 hours. Blue indicates the nucleus (DAPI), green indicates PKCδ, and red indicates VEEV capsid. B) Representative confocal microscopy images of either mock-infected cells or cells infected with VEEV TC-83 (MOI 1.0) for 16 hours. Blue indicates the nucleus (DAPI), green indicates PKCδ, and red indicates VEEV E2. C) Scatter plot of z-stack analysis from confocal microscopy for the entire image. X-axis = capsid, y-axis = PKCδ. Yellow gate shows increased pixel intensity vs. E2. Pearson’s correlation was calculated on regions of interest for capsid/PKCδ co-localization (arrowheads in A). Pearson’s correlation = 0.8603, n = 208 total slices. D) Scatter plot of z-stack analysis from confocal microscopy for the entire image. X-axis = capsid, y-axis = PKCδ. Yellow gate shows decreased pixel intensity vs. capsid. Pearson’s correlation was calculated on regions of interest for capsid/PKCδ co-localization. Pearson’s correlation = 0.3138, n = 118 total slices. p<0.0001 for both C & D.
Fig 3
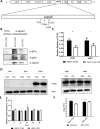
Fig 3. siRNA Knockdown of PKCδ decreases phosphorylation of VEEV capsid.
A) U87MG cells were transfected with 50 nM of the indicated siRNA and incubated for 72 hours. Cell viability was measured using Cell Titer-Glo assay from Promega. Luminescence was measured and normalized to siRNA scramble data. Values are average of 8 biological replicates. B) Western blots probing for PKCδ and actin from cell lysates treated with the indicated siRNA. Band density was analyzed on BioRad Quantity One software and normalized to actin. Normalized values were calculated relative to siScramble and values are below the actin blot in their respective lane. Images are representative of 3 biological replicates. C) U87MG cells were transfected with siRNA against PKCδ or a scrambled control and incubated for 72 hours. Cells were transfected with a plasmid expressing the VEEV structural polyprotein and incubated for 48 hours. Cells were collected, lysed, and immunoprecipitated with α-HA or α-VEEV capsid antibodies. Protein complexes were bound to Protein G Dynabeads, samples were run on SDS-PAGE, and western blot analysis was performed for phospho-Ser or phospho-Thr residues. D) Western blot band density was analyzed on BioRad Quantity One software and normalized to capsid. Normalized values were calculated relative to siScramble transfected cells. Quantitation was performed for 3 biological replicates.
Fig 4
Fig 4. Inhibition of PKCδ causes a decrease in viral replication.
U87MG cells were transfected with 50 nM scramble control or PKCδ siRNAs. Seventy-two hours post-transfection, cells were infected with A) VEEV TC-83 (MOI 0.1) or B) VEEV TrD, EEEV GA97, or WEEV 1930 California (MOI 0.1) and viral supernatants collected at 4, 8, and 16 hpi (panel A) or 16 hpi (panel B) for viral titer determination via plaque assay. C) An alignment of the primary amino acid sequence of VEEV, EEEV, and WEEV is displayed. All residues predicted (but not experimentally verified) are bolded and highlighted in cyan. Residues that were predicted and experimentally verified to be phosphorylated are bolded and highlighted in yellow. Thr 127 which was experimentally shown, but not predicted, is bolded and highlighted in pink. Data is the average of 3 biological replicates ± standard deviation * = p<0.05, ** = p<0.005, *** = p<0.0005.
Fig 5
Fig 5. VEEV CPD shows decreased phosphorylation of capsid and replication is not sensitive to loss of PKCδ.
A) Schematic of the VEEV genome indicating the alanine substitutions made at T93, T108, S124, and T127. B) Vero cells were infected with either VEEV TC-83 or VEEV CPD (MOI 1.0). Cells were collected at 16 hpi, lysed, and immunoprecipitated with α-HA or α-VEEV capsid antibodies. Protein complexes were bound to Protein G Dynabeads, samples were run on SDS-PAGE, and western blot analysis was performed for phospho-Ser or phospho-Thr residues. Images are representative of 3 biological replicates. C) Western blot band density was analyzed on BioRad Quantity One software and normalized to capsid. Normalized values were calculated relative to TC-83 infected cells. Quantitation was performed for 3 biological replicates. * = p<0.05 D) Vero cells were infected with either VEEV TC-83 or VEEV CPD (MOI 1.0). Cells were collected at the indicated time points, lysed, samples were run on SDS-PAGE, and western blot analysis was performed for capsid and actin. E) Band density from panel D was analyzed on BioRad Quantity One software and normalized to actin. Normalized values were calculated relative to TC-83 infected cells respective to each time point (for example, 16hpi CPD is relative to 16hpi TC-83 and 24hpi CPD is relative to 24hpi TC-83). Images were split into early and late time points to allow for longer exposure on 4 and 8 hpi without over exposing the later time points. F) U87MG cells were transfected with 50 nM scramble control or PKCδ siRNAs. Seventy-two hours post-transfection, cells were infected with either VEEV TC-83 or VEEV CPD (MOI 0.1) and viral supernatants collected at 16 hpi for viral titer determination via plaque assay. Values are an average of 3 biological replicates ± standard deviation * = p<0.05, ** = p<0.005.
Fig 6
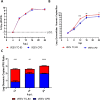
Fig 6. VEEV CPD is more infectious than VEEV TC-83.
Vero cells were infected with either VEEV TC-83 or VEEV CPD (MOI 0.1) and viral supernatants collected at the indicated time points for viral titer determination via A) plaque assay or B) RT-qPCR. C). Genomic copies:PFU ratio was calculated at the indicated time points by converting RT-qPCR genomic copy per reaction data to genomic copies per milliliter. Genomic copies per milliliter were then divided by PFU/mL of the respective time point to obtain the genomic copies to PFU ratio. Values are an average of 3 biological replicates ± standard deviation. * = p<0.05, ** = p<0.005, *** = p<0.0005, **** = p<0.0001.
Fig 7
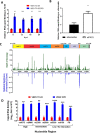
Fig 7. VEEV CPD binds RNA more efficiently than VEEV TC-83.
A) Vero cells were infected with VEEV TC-83 or VEEV CPD (MOI 1.0). Cells were collected at the indicated time points, cross-linked, and cell lysates were immunoprecipitated with either α-HA or α-VEEV capsid antibodies. RT-qPCR against the VEEV packaging signal was performed on RNA isolated from immunocomplexes and normalized relative to a VEEV RNA standard curve generated during the same reaction. Genomic copies per reaction from α-HA immunoprecipitated samples were subtracted from the associated genomic copies from α-capsid immunoprecipitated samples to remove background and then the % RNA bound to capsid was determined by dividing the genomic copies from the input RNA by the normalized immunoprecipitated RNA. RNA:capsid binding of VEEV CPD was normalized relative to VEEV TC-83 samples. B) U87MG cells were transfected with 50 nM scramble control or PKCδ siRNAs. Seventy-two hours post-transfection, cells were infected with VEEV TC-83 (MOI 1.0). Samples were collected at 16hpi and processed in the same manner as panel A. C) A graphical representation of the VEEV Capsid CLIP-Seq data. On the Y-axes are the mean depths of coverage for the VEEV anti-Capsid data sets (Top) and relative statistical significance (Bottom) plotted with respect to nucleotide position (X-axis). Shown above the graphs is a schematic representation of the VEEV TC-83 reference genome (drawn to scale with the X-axis). D) Vero cells were infected with VEEV TC-83 or VEEV CPD (MOI 1.0). Cells were collected at 16 hpi, cross-linked, and cell lysates were immunoprecipitated with either α-HA or α-VEEV capsid antibodies. RT-qPCR against the VEEV canonical packaging signal and the sites identified in panel C was performed on RNA isolated from immunocomplexes and normalized relative to a VEEV RNA standard curve generated during the same reaction. Data analysis was performed as described in panel A. Data is average of 3 biological replicates. * = p<0.05, ** = p<0.005, *** = p<0.0005, **** = p<0.00005.
Fig 8
Fig 8. VEEV CPD is attenuated in mice.
A) Kaplan-Meier survival plot of mice intranasally infected with 2 x 10⁷ pfu/mouse of either VEEV TC-83 or VEEV CPD. N = 10 per group. * = p<0.05. B) Mice were monitored at least daily for clinical symptoms of disease over 21 days. Data are plotted per animal per day. Blue lines indicate a score of 1–3 (primarily reduced activity and weight loss); Orange lines indicate a score of 4 or higher (primarily scruffy and hunched appearance, lethargy, severe weight loss); and red indicates the animal was moribund and euthanized or found dead upon observation.
Fig 9
Fig 9. Working model of the capsid phosphorylation and its impact on viral pathogenesis.
Our working model is that capsid phosphorylation is a mechanism important for regulating capsid:viral RNA binding. Capsid is dephosphorylated by PP1α increasing its ability to bind to viral RNA and conversely phosphorylation by PKCδ decreasing viral RNA binding. Capsid phosphorylation regulates VEEV’s genomic copy to pfu ratio and viral pathogenesis.

References

    1. Kubes V, Rios FA (1939) The Causative Agent of Infectious Equine Encephalomyelitis in Venezuela. Science 90: 20–21. 10.1126/science.90.2323.20 - DOI - PubMed
    1. Weaver SC, Ferro C, Barrera R, Boshell J, Navarro JC (2004) Venezuelan equine encephalitis. Annual Review of Entomology 49: 141–174. 10.1146/annurev.ento.49.061802.123422 - DOI - PubMed
    1. de la Monte S, Castro F, Bonilla NJ, Gaskin de Urdaneta A, Hutchins GM (1985) The systemic pathology of Venezuelan equine encephalitis virus infection in humans. Am J Trop Med Hyg 34: 194–202. 10.4269/ajtmh.1985.34.194 - DOI - PubMed
    1. Gardner CL, Burke CW, Tesfay MZ, Glass PJ, Klimstra WB, et al. (2008) Eastern and Venezuelan equine encephalitis viruses differ in their ability to infect dendritic cells and macrophages: impact of altered cell tropism on pathogenesis. J Virol 82: 10634–10646. 10.1128/JVI.01323-08 - DOI - PMC - PubMed
    1. Sidwell RW, Gebhardt LP, Thorpe BD (1967) Epidemiological aspects of venezuelan equine encephalitis virus infections. Bacteriol Rev 31: 65–81. - PMC - PubMed

Publication types

MeSH terms