. 2020 Mar 10;4(5):930-942.
doi: 10.1182/bloodadvances.2019001008.

The application of RNA sequencing for the diagnosis and genomic classification of pediatric acute lymphoblastic leukemia

Affiliations

The application of RNA sequencing for the diagnosis and genomic classification of pediatric acute lymphoblastic leukemia

Lauren M Brown et al. Blood Adv. .

Erratum in

Abstract

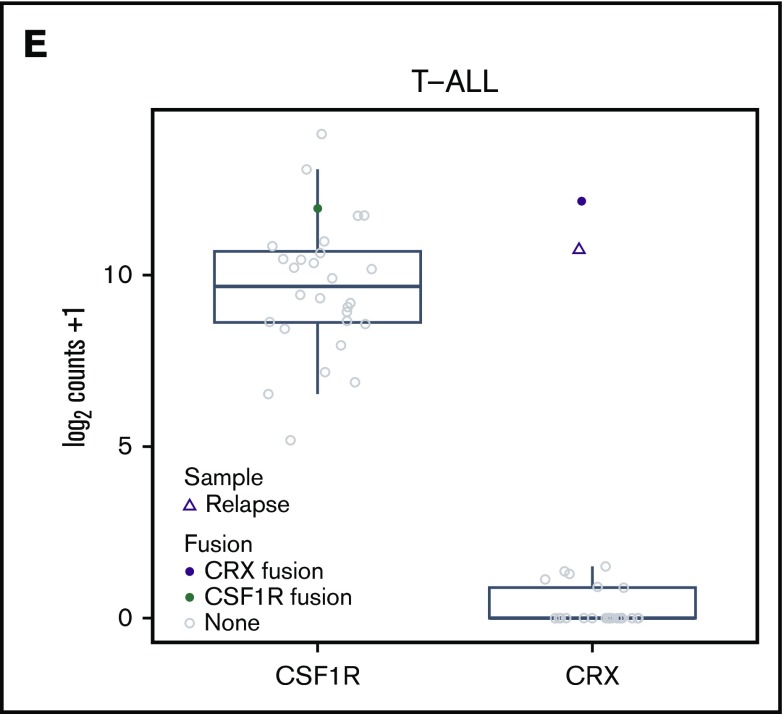
Acute lymphoblastic leukemia (ALL) is the most common childhood malignancy, and implementation of risk-adapted therapy has been instrumental in the dramatic improvements in clinical outcomes. A key to risk-adapted therapies includes the identification of genomic features of individual tumors, including chromosome number (for hyper- and hypodiploidy) and gene fusions, notably ETV6-RUNX1, TCF3-PBX1, and BCR-ABL1 in B-cell ALL (B-ALL). RNA-sequencing (RNA-seq) of large ALL cohorts has expanded the number of recurrent gene fusions recognized as drivers in ALL, and identification of these new entities will contribute to refining ALL risk stratification. We used RNA-seq on 126 ALL patients from our clinical service to test the utility of including RNA-seq in standard-of-care diagnostic pipelines to detect gene rearrangements and IKZF1 deletions. RNA-seq identified 86% of rearrangements detected by standard-of-care diagnostics. KMT2A (MLL) rearrangements, although usually identified, were the most commonly missed by RNA-seq as a result of low expression. RNA-seq identified rearrangements that were not detected by standard-of-care testing in 9 patients. These were found in patients who were not classifiable using standard molecular assessment. We developed an approach to detect the most common IKZF1 deletion from RNA-seq data and validated this using an RQ-PCR assay. We applied an expression classifier to identify Philadelphia chromosome-like B-ALL patients. T-ALL proved a rich source of novel gene fusions, which have clinical implications or provide insights into disease biology. Our experience shows that RNA-seq can be implemented within an individual clinical service to enhance the current molecular diagnostic risk classification of ALL.


Conflict of interest statement

Conflict-of-interest disclosure: The authors declare no competing financial interests.

Figures

None
Graphical abstract
Figure 1.
Figure 1.
Fusion genes identified in B-ALL patients. Data are presented for 99 patients with B-ALL on whom we performed RNA-seq. Each column represents a single patient. Patients were classified as “Defined” if they fell into a WHO-established subtype (n = 67) or “Undefined” (n = 32), according to the key. NCI risk classification, MRD at the end of induction, outcome data, where event indicates death or relapse, and IKZF1 status, determined by microarray or RQ-PCR assay, are shown for each patient and colored according to the key. Rearrangements are identified by standard clinical test (standard) including G-banding analysis (karyotype) or FISH analysis and are shown in green. The RNA-seq row denotes fusions identified by RNA-seq using JAFFA and are shown in blue. The gray and blue bar represents a sample in which an IGH-CRLF2 rearrangement, identified by karyotype, was missed by RNA-seq but a PAX5 rearrangement was identified by RNA-seq. Nonstandard rearrangements identified are colored according to the key. *IGH-CRLF2 rearrangement identified by karyotype and not identified by RNA-seq.
Figure 2.
Figure 2.
Gene rearrangements and fusion genes identified in T-ALL patients. (A) Data are presented for 27 patients with T-ALL on whom we performed RNA-seq. Each column represents a single patient. Patients who were classified into the WHO provisional subtype early T-cell precursor ALL (ETP-ALL) are classified as defined (n = 4), and the remaining patients were classified as undefined (n = 23). MRD at EOI and EOC, and outcome data, where event indicates death or relapse, are shown for each patient and colored according to the key. Rearrangements identified by standard clinical test (standard) include gene rearrangements identified by either karyotype or FISH
Figure 2.
Figure 2.
Gene rearrangements and fusion genes identified in T-ALL patients. (A) Data are presented for 27 patients with T-ALL on whom we performed RNA-seq. Each column represents a single patient. Patients who were classified into the WHO provisional subtype early T-cell precursor ALL (ETP-ALL) are classified as defined (n = 4), and the remaining patients were classified as undefined (n = 23). MRD at EOI and EOC, and outcome data, where event indicates death or relapse, are shown for each patient and colored according to the key. Rearrangements identified by standard clinical test (standard) include gene rearrangements identified by either karyotype or FISH
Figure 3.
Figure 3.
Gene expression analysis of genes recurrently altered in B- and T-ALL. (A) Gene expression analysis of all B-ALL samples analyzing expression of ABL1, JAK2, KMT2A, IL3, and CRLF2. Plots show gene names on the x-axis and gene expression (log2 [counts +1]) on the y-axis. Box plots show mean and interquartile range. Samples in which a fusion was identified by RNA-seq involving that particular gene are green. Samples containing rearrangements involving IGH are pink and were missed by RNA-seq (IGHr). All other samples that contain gene fusions missed by RNA-seq are red (Missed). (B) Gene expression analysis of all T-ALL samples showing expression levels of MYC and TLX1. Plots show gene name on the x-axis and gene expression (log2 [counts +1]) on the y-axis. Box plots show mean and interquartile range. Samples in which a fusion was identified by RNA-seq involving MYC or TLX1 are light pink or pink, respectively. All remaining samples are gray.
Figure 4.
Figure 4.
Identifying IKZF1 deletions using RNA-seq data. (A) Schematic of the IKZF1 canonical transcript (IK1) and augmented deletion transcripts, del4-7, del4-8, del2-7, and del2-8. Each coding exon is colored, and noncoding exons are gray. The exons encoding the N-terminal DNA-binding, and C-terminal dimerization domains are indicated by arrows. (B) Expression levels of IK1 (ENST00000331340) in all B-ALL samples (including 99 diagnosis samples and matched relapse for 2 samples). Plot shows transcripts per million (TPM) on the y-axis. (C-D) Relationship between expression of the IKZF1 del 4-7 transcript and IKZF1 del 4-8 and total IKZF1 expression (the sum of all IKZF1 transcripts). Samples that have the respective IKZF1 deletion transcript are colored and all other samples are shown in gray. The legend for panels B-D is shown at top right. Samples are colored by IKZF1 deletion status based on primary and secondary RQ-PCR results, according to the key. Samples that have not been tested for IKZF1 deletion (unknown) or are confirmed nondeletions (undetected) are gray. Samples that were identified in primary RQ-PCR analysis, as part of clinical diagnostics (clinical RQ-PCR result) are depicted by circles, and samples that were predicted by RNA-seq and validated by secondary RQ-PCR (RNA-seq predicted and validated) are depicted by triangles. Samples that were predicted by RNA-seq to have an IKZF1 deletion but were not validated by RQ-PCR (unvalidated) are depicted by unfilled triangles.
Figure 5.
Figure 5.
Using a B-ALL gene expression classifier to identify Ph-like, ETV6-RUNX1+, and ERG-deleted/DUX4-rearranged cases. Bar chart of prediction probabilities for B-ALL samples grouped by molecular subtype BCR-ABL1, ETV6-RUNX1, ETV6 other, IL3-IGH, CRLF2-rearranged, ABL-class, JAK2-rearranged, or undefined. Samples were classified into Ph-like (red), ETV6-RUNX1+(orange), or ERG-deleted (blue) if they received a prediction score over 0.5 for any of these classes. Samples that were classified as other with a prediction score >0.75 or were not classified are gray. Bars are dark colored for samples where the patient either relapsed or died and light colored for all other cases.

Similar articles

Cited by

References

    1. Ward E, DeSantis C, Robbins A, Kohler B, Jemal A. Childhood and adolescent cancer statistics, 2014. CA Cancer J Clin. 2014;64(2):83-103. - PubMed
    1. Roberts KG, Mullighan CG. Genomics in acute lymphoblastic leukaemia: insights and treatment implications. Nat Rev Clin Oncol. 2015;12(6):344-357. - PubMed
    1. Mullighan CG, Goorha S, Radtke I, et al. . Genome-wide analysis of genetic alterations in acute lymphoblastic leukaemia. Nature. 2007;446(7137):758-764. - PubMed
    1. Mullighan CG, Zhang J, Harvey RC, et al. . JAK mutations in high-risk childhood acute lymphoblastic leukemia. Proc Natl Acad Sci USA. 2009;106(23):9414-9418. - PMC - PubMed
    1. Mullighan CG, Su X, Zhang J, et al. ; Children’s Oncology Group . Deletion of IKZF1 and prognosis in acute lymphoblastic leukemia. N Engl J Med. 2009;360(5):470-480. - PMC - PubMed

Publication types

MeSH terms

Substances