

Inhibition of PHLPP1 ameliorates cardiac dysfunction via activation of the PI3K/Akt/mTOR signalling pathway in diabetic cardiomyopathy
- PMID: 32150791
- PMCID: PMC7176843
- DOI: 10.1111/jcmm.15123
Inhibition of PHLPP1 ameliorates cardiac dysfunction via activation of the PI3K/Akt/mTOR signalling pathway in diabetic cardiomyopathy
Abstract
Background: Pleckstrin homology (PH) domain leucine-rich repeat protein phosphatase 1 (PHLPP1) is a kind of serine/threonine phosphatase, whose dysregulation is accompanied with numerous human diseases. However, its role in diabetic cardiomyopathy remains unclear. We explored the underlying function and mechanism of PHLPP1 in diabetic cardiomyopathy (DCM).
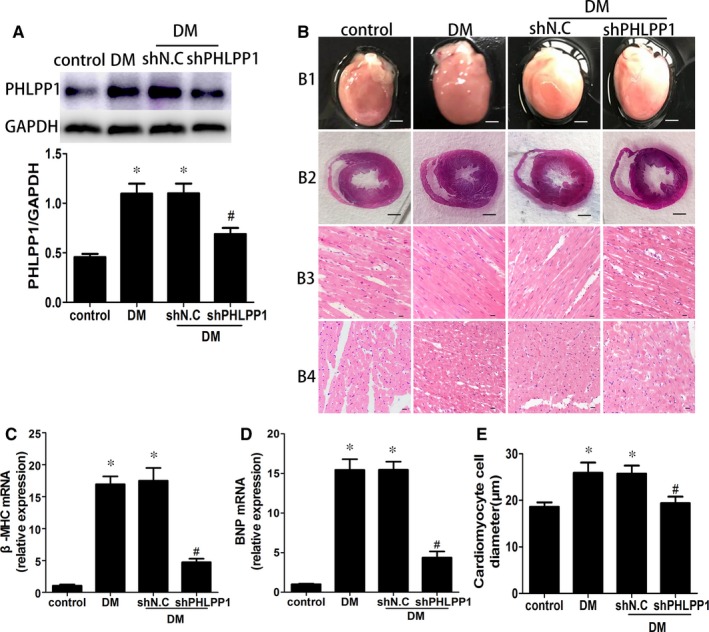
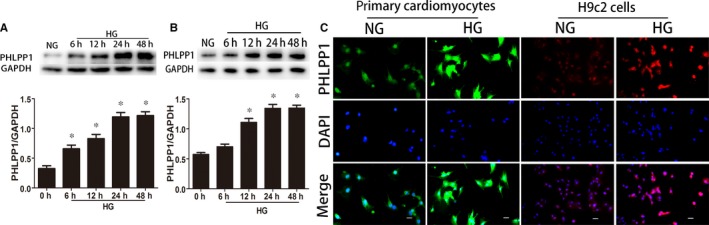
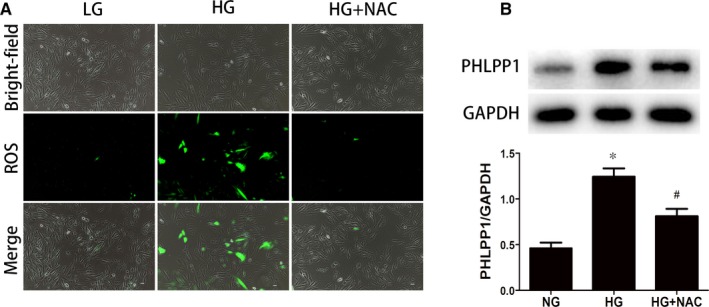
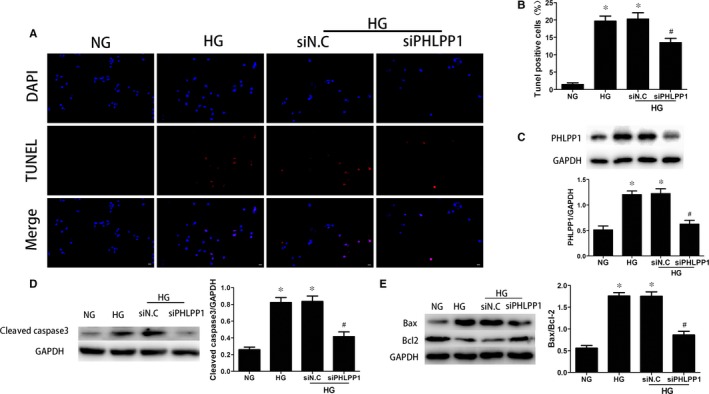
Method: In vivo, Type 1 diabetic rats were induced by intraperitoneal injection of 60 mg/kg streptozotocin (STZ). Lentivirus-mediated short hairpin RNA (shRNA) was used to knock down the expression of PHLPP1. In vitro, primary neonatal rat cardiomyocytes and H9C2 cells were incubated in 5.5 mmol/L glucose (normal glucose, NG) or 33.3 mmol/L glucose (high glucose, HG). PHLPP1 expression was inhibited by PHLPP1-siRNA to probe into the function of PHLPP1 in high glucose-induced apoptosis in H9c2 cells.
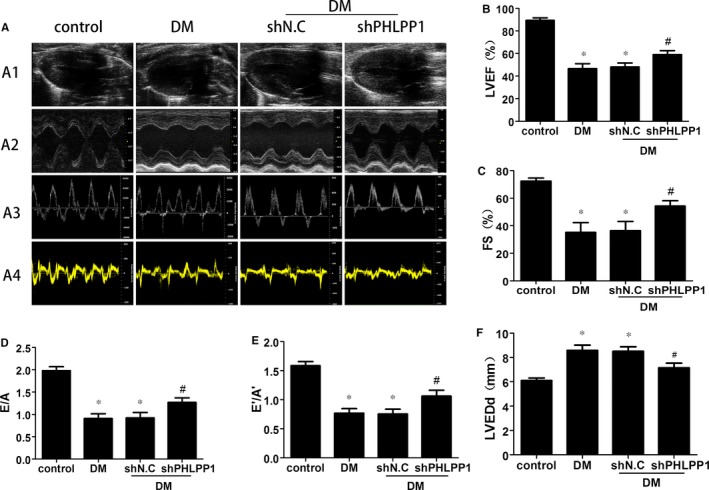
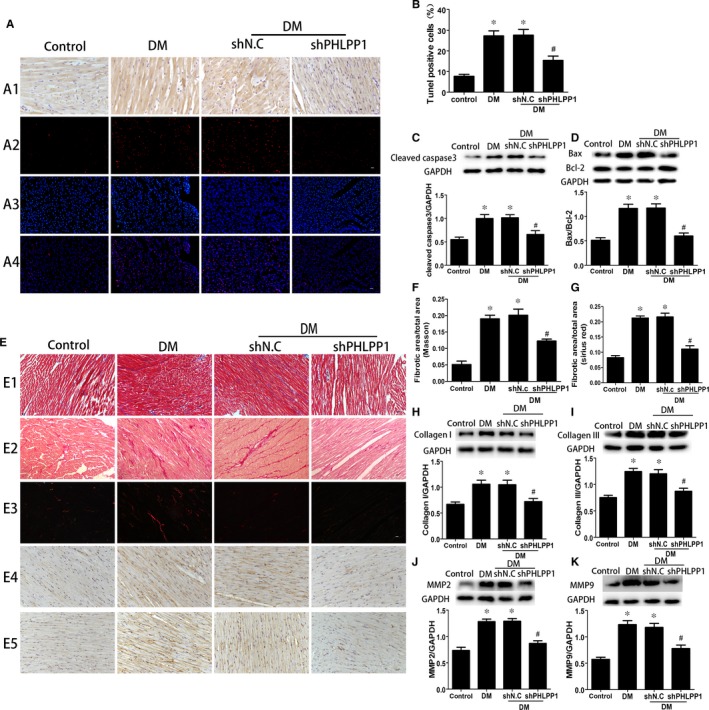
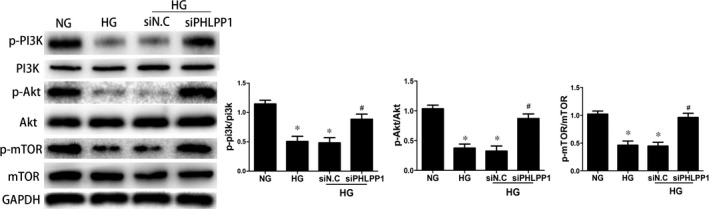
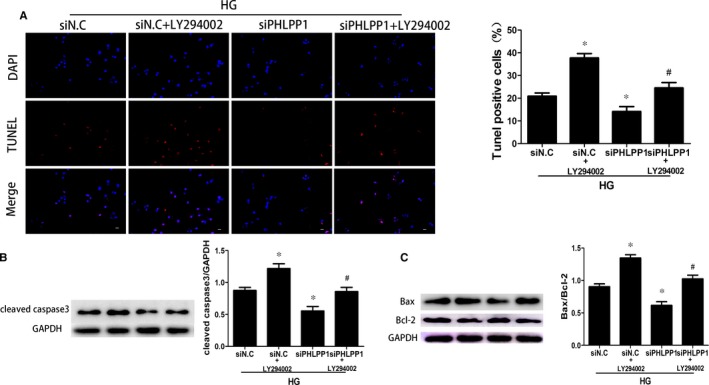
Results: Diabetic rats showed up-regulated PHLPP1 expression, left ventricular dysfunction, increased myocardial apoptosis and fibrosis. PHLPP1 inhibition alleviated cardiac dysfunction. Additionally, PHLPP1 inhibition significantly reduced HG-induced apoptosis and restored PI3K/AKT/mTOR pathway activity in H9c2 cells. Furthermore, pretreatment with LY294002, an inhibitor of PI3K/Akt/mTOR pathway, abolished the anti-apoptotic effect of PHLPP1 inhibition.
Conclusion: Our study indicated that PHLPP1 inhibition alleviated cardiac dysfunction via activating the PI3K/Akt/mTOR signalling pathway in DCM. Therefore, PHLPP1 may be a novel therapeutic target for human DCM.
Keywords: PHLPP1; PI3K/Akt/mTOR signal; apoptosis; diabetic cardiomyopathy; fibrosis.
© 2020 The Authors. Journal of Cellular and Molecular Medicine published by Foundation for Cellular and Molecular Medicine and John Wiley & Sons Ltd.
Conflict of interest statement
The authors declare that there is no conflict of interest.
Figures
Similar articles
-
[Down-regulation of PHLPP1 expression ameliorates high glucose-induced autophagy inhibition and apoptosis promotion of podocytes by activating PI3K/AKT/mTOR pathway].Xi Bao Yu Fen Zi Mian Yi Xue Za Zhi. 2021 Jan;37(1):8-15. Xi Bao Yu Fen Zi Mian Yi Xue Za Zhi. 2021. PMID: 33441223 Chinese.
-
Inhibition of prolyl hydroxylase 3 ameliorates cardiac dysfunction in diabetic cardiomyopathy.Mol Cell Endocrinol. 2015 Mar 5;403:21-9. doi: 10.1016/j.mce.2015.01.014. Epub 2015 Jan 13. Mol Cell Endocrinol. 2015. PMID: 25595486
-
BRD7 mediates hyperglycaemia-induced myocardial apoptosis via endoplasmic reticulum stress signalling pathway.J Cell Mol Med. 2017 Jun;21(6):1094-1105. doi: 10.1111/jcmm.13041. Epub 2016 Dec 13. J Cell Mol Med. 2017. PMID: 27957794 Free PMC article.
-
PHLPPs: Emerging players in metabolic disorders.Drug Discov Today. 2022 Oct;27(10):103317. doi: 10.1016/j.drudis.2022.07.002. Epub 2022 Jul 11. Drug Discov Today. 2022. PMID: 35835313 Review.
-
MicroRNAs: A Critical Regulator and a Promising Therapeutic and Diagnostic Molecule for Diabetic Cardiomyopathy.Curr Gene Ther. 2021;21(4):313-326. doi: 10.2174/1566523221666210311111619. Curr Gene Ther. 2021. PMID: 33719971 Review.
Cited by
-
Nascent shifts in renal cellular metabolism, structure, and function due to chronic empagliflozin in prediabetic mice.Am J Physiol Cell Physiol. 2024 Apr 1;326(4):C1272-C1290. doi: 10.1152/ajpcell.00446.2023. Epub 2024 Mar 4. Am J Physiol Cell Physiol. 2024. PMID: 38602847 Free PMC article.
-
Molecular targets and mechanisms of Jiawei Jiaotai Pill on diabetic cardiomyopathy based on network pharmacology.World J Diabetes. 2023 Nov 15;14(11):1659-1671. doi: 10.4239/wjd.v14.i11.1659. World J Diabetes. 2023. PMID: 38077804 Free PMC article.
-
Alternate-day fat diet and exenatide modulate the brain leptin JAK2/STAT3/SOCS3 pathway in a fat diet-induced obesity and insulin resistance mouse model.Arch Med Sci. 2023 Feb 1;19(5):1508-1519. doi: 10.5114/aoms/158534. eCollection 2023. Arch Med Sci. 2023. PMID: 37732053 Free PMC article.
-
Pleckstrin homology (PH) domain and Leucine Rich Repeat Phosphatase 1 (Phlpp1) Suppresses Parathyroid Hormone Receptor 1 (Pth1r) Expression and Signaling During Bone Growth.J Bone Miner Res. 2021 May;36(5):986-999. doi: 10.1002/jbmr.4248. Epub 2021 Feb 8. J Bone Miner Res. 2021. PMID: 33434347 Free PMC article.
-
Inhibition of PHLPP1/2 phosphatases rescues pancreatic β-cells in diabetes.Cell Rep. 2021 Aug 3;36(5):109490. doi: 10.1016/j.celrep.2021.109490. Cell Rep. 2021. PMID: 34348155 Free PMC article.
References
-
- Zimmet P, Alberti KG, Magliano DJ, Bennett PH. Diabetes mellitus statistics on prevalence and mortality: facts and fallacies. Nat Rev Endocrinol. 2016;12(10):616‐622. - PubMed
-
- Huynh K, Bernardo BC, McMullen JR, Ritchie RH. Diabetic cardiomyopathy: mechanisms and new treatment strategies targeting antioxidant signaling pathways. Pharmacol Ther. 2014;142(3):375‐415. - PubMed
-
- Fang ZY, Prins JB, Marwick TH. Diabetic cardiomyopathy: evidence, mechanisms, and therapeutic implications. Endocrine Rev. 2004;25(4):543‐567. - PubMed
-
- Boudina S, Abel ED. Diabetic cardiomyopathy revisited. Circulation. 2007;115(25):3213‐3223. - PubMed
Publication types
MeSH terms
Substances
LinkOut - more resources
Full Text Sources
Medical
Molecular Biology Databases
Miscellaneous
