. 2020 Mar 31;43(3):298-303.
doi: 10.14348/molcells.2020.2238.

Real-Time Measurement of the Liquid Amount in Cryo-Electron Microscopy Grids Using Laser Diffraction of Regular 2-D Holes of the Grids

Affiliations

Real-Time Measurement of the Liquid Amount in Cryo-Electron Microscopy Grids Using Laser Diffraction of Regular 2-D Holes of the Grids

Jinsook Ahn et al. Mol Cells. .

Abstract

Cryo-electron microscopy (cryo-EM) is now the first choice to determine the high-resolution structures of huge protein complexes. Grids with two-dimensional arrays of holes covered with a carbon film are typically used in cryo-EM. Although semi-automatic plungers are available, notable trial-and-error is still required to obtain a suitable grid specimen. Herein, we introduce a new method to obtain thin ice specimens using real-time measurement of the liquid amounts in cryo-EM grids. The grids for cryo-EM strongly diffracted laser light, and the diffraction intensity of each spot was measurable in real-time. The measured diffraction patterns represented the states of the liquid in the holes due to the curvature of the liquid around them. Using the diffraction patterns, the optimal time point for freezing the grids for cryo-EM was obtained in real-time. This development will help researchers rapidly determine highresolution protein structures using the limited resource of cryo-EM instrument access.

Keywords: cryo electron microscopy; grid preparation; laser diffraction; real-time measurement; vitreous ice.


Conflict of interest statement

Disclosure

The authors have no potential conflicts of interest to disclose.

Figures
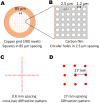
Fig. 1
Fig. 1. Quantifoil grid (R1.2/1.3, 300-mesh copper grid) and its predicted diffraction patterns from a 650-nm laser beam at a 10-cm distance.
(A) Schematic of a 300-mesh Quantifoil grid with 85-μm spacing. (B) Enlarged schematic view of the holes in the carbon film, with the diameter and spacing of the holes, was indicated. (C) The calculated diffraction pattern of a 300-mesh square grid at a 10-cm distance using a 650-nm laser beam. (D) The calculated diffraction pattern of the 2.5-μm spacing of the circular holes.
Fig. 2
Fig. 2. A representative diffraction image of a Quantifoil grid (R 1.2/1.3, 300-mesh copper grid) at a 10-cm distance from the screen using laser light at 650 nm.
Rectangular black tape was attached to reduce the intensity of the direct beam (0, 0). The cross-hair line with 0.9-mm spacing (green arrow) is due to the 300-mesh copper grid. The indexed spots from the holes in the carbon film on the grid were represented.
Fig. 3
Fig. 3. Schematic of the plunging apparatus.
The laser/filter paper (FP) assembly moves between the ‘R’ and ‘A’ positions. The laser (red line or red circle) is aligned horizontally to the Quantifoil grid (QG), which is affixed using a sharp tweezer. The diffraction spots appear on the screen, and the CdS light sensor measures the light intensity of a spot in real-time. (A) In the ‘R’ position, the light intensity of the spot from the empty QG is recorded, and then the sample is loaded onto the QG. (B) The laser/FP assembly is moved to the ‘A’ position. The FP, cut into a V-shape, absorbs the liquid on the QG at time 0. Then, the graph showing the light intensity of the spot is produced for the time course. (C) Alignment of the QG, the V-cut filter paper, and the laser beam. The laser beam passes through space in the V-cut filter paper and irradiates the QG.
Fig. 4
Fig. 4. Changes in diffraction patterns when pure water is loaded on the grids.
(A) The time-dependent light scattering profiles of DW. One diffraction spot (–1, 0) was recorded using the CdS-based sensor and is circled in the image (B). The light intensity value was represented as Lx, which is arbitrary units. Time 0 is when the laser/filter paper module contacted the grid. The initial light intensity was represented as a red arrow. The image at (a) shows the diffraction image of the empty grid. (B) The diffraction patterns of DW at the time points (c, e, g, and h) denoted in (A).
Fig. 5
Fig. 5. Overall atlas of the grid showing a vitrified sample on a Quantifoil grid.
(A) Representative grid atlas collected using EPU (Thermo Fisher Scientific) showing constant ice thickness in most of the grid squares. (B) TEM images of holey carbon grids with embedded vitreous ice.
Fig. 6
Fig. 6. Interpretation of liquid amounts in holes and diffraction images.
(A-F) The predicted liquid curvature in the hole that affects the diffraction patterns over blotting time. The hypothetical liquid amounts in the holes for each diffraction image (right) are represented on the left. The diffracted reflection was produced when the laser faced another medium. The refraction patterns of the laser were used to determine the curvature of the liquid in the holes. Gray squares represent the ends of the holes in the Quantifoil grid, and blue represents water.

Similar articles

Cited by

References

    1. Arnold S.A., Albiez S., Bieri A., Syntychaki A., Adaixo R., McLeod R.A., Goldie K.N., Stahlberg H., Braun T. Blotting-free and lossless cryo-electron microscopy grid preparation from nanoliter-sized protein samples and single-cell extracts. J. Struct. Biol. 2017;197:220–226. doi: 10.1016/j.jsb.2016.11.002. - DOI - PubMed
    1. Bai X.C., McMullan G., Scheres S.H. How cryo-EM is revolutionizing structural biology. Trends Biochem. Sci. 2015;40:49–57. doi: 10.1016/j.tibs.2014.10.005. - DOI - PubMed
    1. Binshtein E., Ohi M.D. Cryo-electron microscopy and the amazing race to atomic resolution. Biochemistry. 2015;54:3133–3141. doi: 10.1021/acs.biochem.5b00114. - DOI - PubMed
    1. Feng X., Fu Z., Kaledhonkar S., Jia Y., Shah B., Jin A., Liu Z., Sun M., Chen B., Grassucci R.A. A fast and effective microfluidic spraying-plunging method for high-resolution single-particle cryo-EM. Structure. 2017;25:663–670.:e3. doi: 10.1016/j.str.2017.02.005. - DOI - PMC - PubMed
    1. Glaeser R.M. Retrospective: radiation damage and its associated "information limitations". J. Struct. Biol. 2008;163:271–276. doi: 10.1016/j.jsb.2008.06.001. - DOI - PubMed

MeSH terms

LinkOut - more resources