. 2020 Mar 5;21(5):1781.
doi: 10.3390/ijms21051781.

Comparative Root Transcriptomics Provide Insights into Drought Adaptation Strategies in Chickpea (Cicer arietinum L.)

Affiliations

Comparative Root Transcriptomics Provide Insights into Drought Adaptation Strategies in Chickpea (Cicer arietinum L.)

Vijay Bhaskarla et al. Int J Mol Sci. .

Abstract

Drought adversely affects crop production across the globe. The root system immensely contributes to water management and the adaptability of plants to drought stress. In this study, drought-induced phenotypic and transcriptomic responses of two contrasting chickpea (Cicer arietinum L.) genotypes were compared at the vegetative, reproductive transition, and reproductive stages. At the vegetative stage, drought-tolerant genotype maintained higher root biomass, length, and surface area under drought stress as compared to sensitive genotype. However, at the reproductive stage, root length and surface area of tolerant genotype was lower but displayed higher root diameter than sensitive genotype. The shoot biomass of tolerant genotype was overall higher than the sensitive genotype under drought stress. RNA-seq analysis identified genotype- and developmental-stage specific differentially expressed genes (DEGs) in response to drought stress. At the vegetative stage, a total of 2161 and 1873 DEGs, and at reproductive stage 4109 and 3772 DEGs, were identified in the tolerant and sensitive genotypes, respectively. Gene ontology (GO) analysis revealed enrichment of biological categories related to cellular process, metabolic process, response to stimulus, response to abiotic stress, and response to hormones. Interestingly, the expression of stress-responsive transcription factors, kinases, ROS signaling and scavenging, transporters, root nodulation, and oxylipin biosynthesis genes were robustly upregulated in the tolerant genotype, possibly contributing to drought adaptation. Furthermore, activation/repression of hormone signaling and biosynthesis genes was observed. Overall, this study sheds new insights on drought tolerance mechanisms operating in roots with broader implications for chickpea improvement.

Keywords: abiotic stress; chickpea; drought; gene expression; hormone; root; signaling.


Conflict of interest statement

The authors declare no conflict of interest.

Figures

Figure 1
Figure 1
Growth and physiological responses of tolerant (T, ICC8261) and sensitive (S, ICC283) chickpea genotypes to drought stress during vegetative (VS), reproductive transition (RTS) and reproductive (RS) stages. (A) root dry weight (B) root length (C) root surface area (D) average diameter (E) root volume (F) relative water content (G) shoot dry weight (H) chlorophyll content (I) specific leaf area (SLA). Error bars represent standard errors (SE). Physiological data were obtained from three independent biological replicates. Statistically significant differences between sensitive and tolerant genotypes obtained by one-way ANOVA at p < 0.05 are depicted by an asterisk (*).
Figure 2
Figure 2
Bar graphs and Venn diagram representing genotype- and developmental stage-specific differentially expressed genes (DEGs) in response to drought stress. (A) DEGs up- and down-regulated in the tolerant (T, ICC8261) and sensitive (S, ICC283) genotypes at the vegetative stage (VS); (B) Venn diagram showing commonly up- and down-regulated DEGs amongst the genotypes at the vegetative stage (VS); (C) DEGs up- and down-regulated in the tolerant (T, ICC8261) and sensitive (S, ICC283) genotypes at the reproductive stage (RS); (D) Venn diagram showing commonly up- and down-regulated DEGs amongst the genotypes at the reproductive stage (RS).
Figure 3
Figure 3
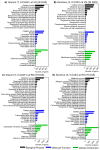
Genotype- and developmental stage-specific enrichment of gene ontology (GO) terms in (A) tolerant (T, ICC8261) genotype at vegetative stage (VS) (B) sensitive (S, ICC283) genotype at vegetative stage (VS) (C) tolerant (T, ICC8251) genotype at reproductive stage (RS) and (D) sensitive (S, ICC283) genotype at reproductive stage (RS).
Figure 4
Figure 4
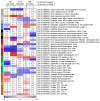
Heat map illustrating differential expression of various transcription factor (TF) gene families in the tolerant (T, ICC8261) and sensitive genotype (S, ICC283) at vegetative (VS), reproductive transition (RTS) and reproductive (RS) stages. The scale color represents log2 fold change.
Figure 5
Figure 5
Heat map illustrating differential expression of various protein kinases (PK), detoxification enzymes (DET) and respiratory burst oxidases (RBOH) in the tolerant (T, ICC8261) and sensitive genotype (S, ICC283) at vegetative (VS), reproductive transition (RTS) and reproductive (RS) stages. The scale color represents log2 fold change.
Figure 6
Figure 6
Heatmap illustrating differential expression of various transporters and root-nodule development genes that include ABC-transporters (ABC), sugar transporters (ST), NRT1/PTR transporter family (NRT1/PTR), aquaporins (AQP) and nodulation related genes (NOD) in the tolerant (T, ICC8261) and sensitive genotype (S, ICC283) at vegetative (VS), reproductive transition (RTS) and reproductive (RS) stages. The scale color represents log2 fold change.
Figure 7
Figure 7
Heatmap illustrating differential regulation of auxin (AUX), cytokinin (CK), ethylene (ETH), abscisic acid (ABA), gibberellic acid (GA)and jasmonic acid (JA) related genes in the tolerant (T, ICC8261) and sensitive genotype (S, ICC283) at vegetative (VS), reproductive transition (RTS) and reproductive (RS) stages. The scale color represents log2 fold change.

Similar articles

Cited by

References

    1. Farooq M., Wahid A., Kobayashi N., Fujita D., Basra S. Sustainable Agriculture. Springer; Berlin/Heidelberg, Germany: 2009. Plant drought stress: Effects, mechanisms and management; pp. 153–188.
    1. Easterling D.R., Meehl G.A., Parmesan C., Changnon S.A., Karl T.R., Mearns L.O. Climate extremes: Observations, modeling, and impacts. Science. 2000;289:2068–2074. doi: 10.1126/science.289.5487.2068. - DOI - PubMed
    1. Varshney R.K., Glaszmann J.-C., Leung H., Ribaut J.-M. More genomic resources for less-studied crops. Trends Biotechnol. 2010;28:452–460. doi: 10.1016/j.tibtech.2010.06.007. - DOI - PubMed
    1. Leport L., Turner N.C., Davies S.L., Siddique K.H.M. Variation in pod production and abortion among chickpea cultivars under terminal drought. Eur. J. Agron. 2006;24:236–246. doi: 10.1016/j.eja.2005.08.005. - DOI
    1. Fang X., Turner N.C., Yan G., Li F., Siddique K.H.M. Flower numbers, pod production, pollen viability, and pistil function are reduced and flower and pod abortion increased in chickpea (Cicer arietinum L.) under terminal drought. J. Exp. Bot. 2009;61:335–345. doi: 10.1093/jxb/erp307. - DOI - PMC - PubMed

LinkOut - more resources