. 2020 Mar 5;11(3):278.
doi: 10.3390/genes11030278.

Seascape Genetics and the Spatial Ecology of Juvenile Green Turtles

Affiliations

Seascape Genetics and the Spatial Ecology of Juvenile Green Turtles

Michael P Jensen et al. Genes (Basel). .

Abstract

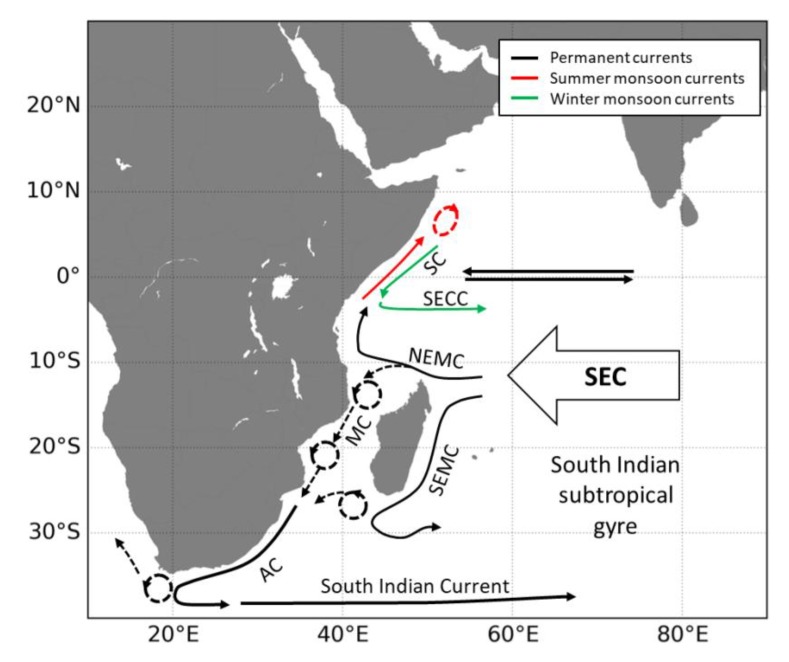
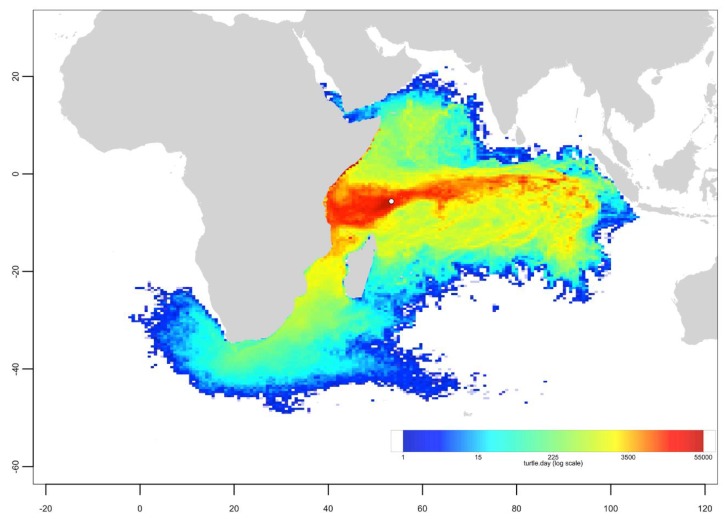
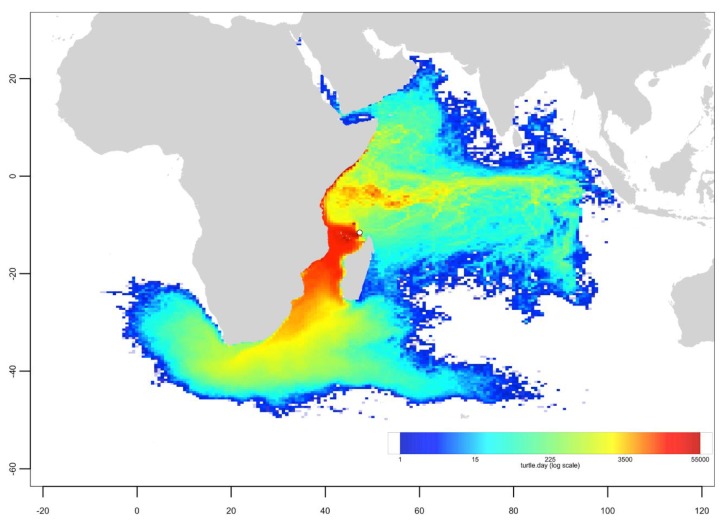
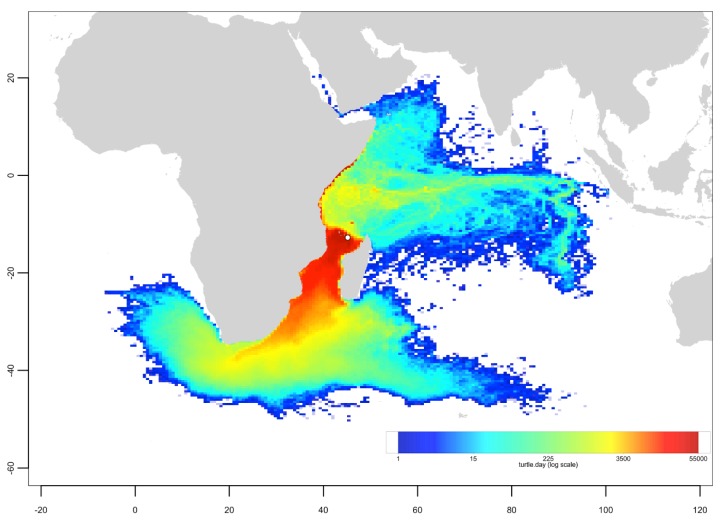
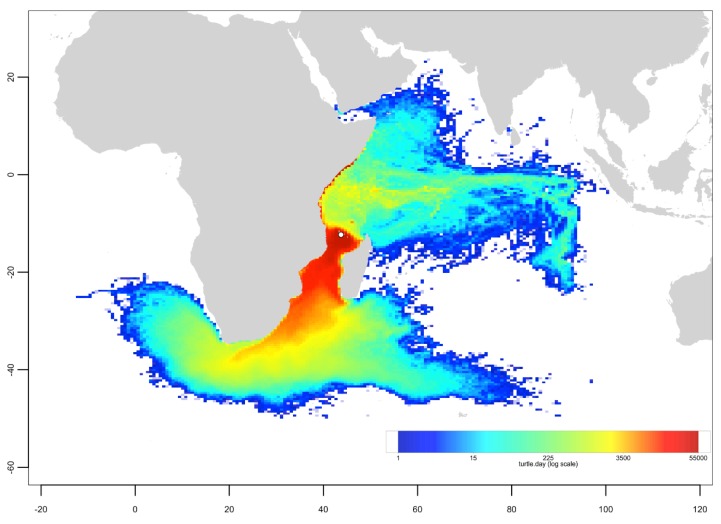
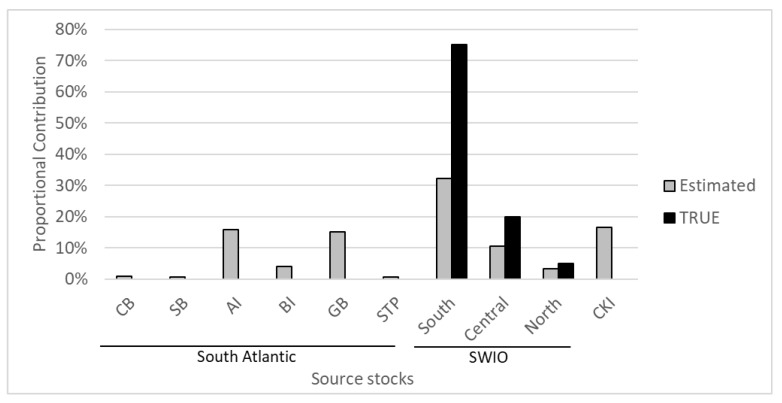
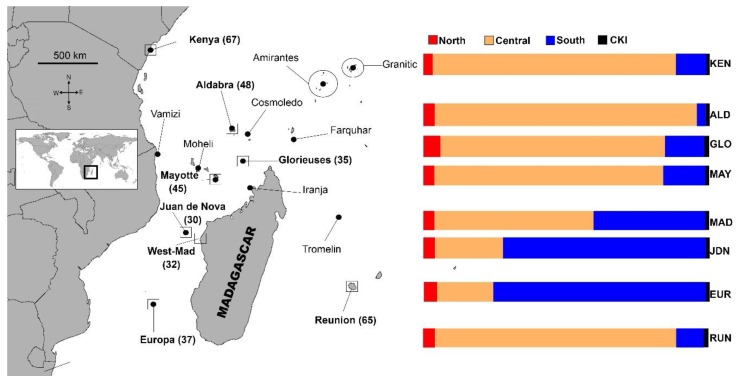
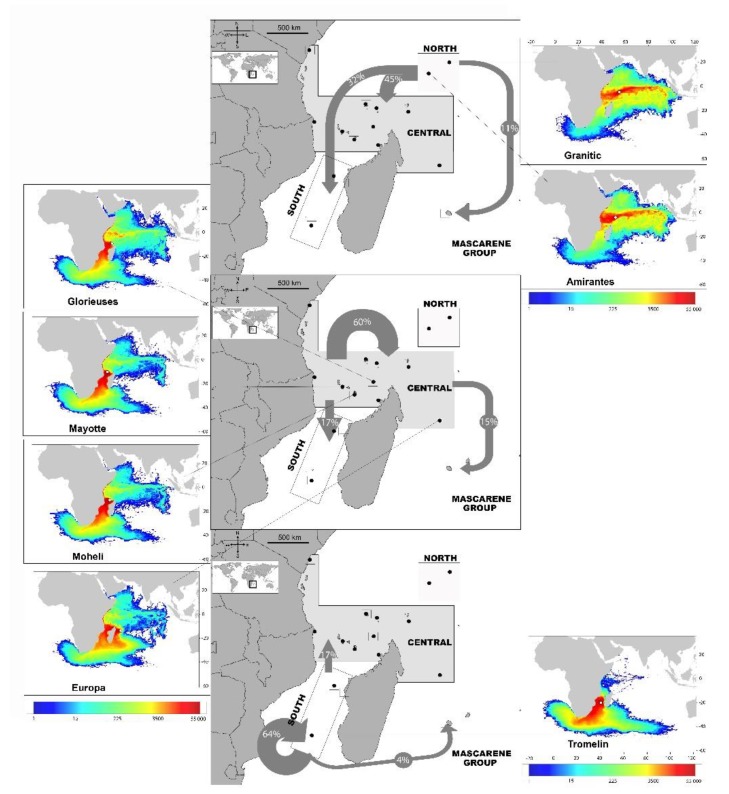
Understanding how ocean currents impact the distribution and connectivity of marine species, provides vital information for the effective conservation management of migratory marine animals. Here, we used a combination of molecular genetics and ocean drift simulations to investigate the spatial ecology of juvenile green turtle (Chelonia mydas) developmental habitats, and assess the role of ocean currents in driving the dispersal of green turtle hatchlings. We analyzed mitochondrial (mt)DNA sequenced from 358 juvenile green turtles, and from eight developmental areas located throughout the Southwest Indian Ocean (SWIO). A mixed stock analysis (MSA) was applied to estimate the level of connectivity between developmental sites and published genetic data from 38 known genetic stocks. The MSA showed that the juvenile turtles at all sites originated almost exclusively from the three known SWIO stocks, with a clear shift in stock contributions between sites in the South and Central Areas. The results from the genetic analysis could largely be explained by regional current patterns, as shown by the results of passive numerical drift simulations linking breeding sites to developmental areas utilized by juvenile green turtles. Integrating genetic and oceanographic data helps researchers to better understand how marine species interact with ocean currents at different stages of their lifecycle, and provides the scientific basis for effective conservation management.

Keywords: Chelonia mydas; Southwest Indian Ocean; connectivity; drifting simulation; green turtle; juvenile; mixed stock analysis; mtDNA.


Conflict of interest statement

The authors declare no conflict of interest.

Figures

Figure A1
Figure A1
Schematic representation of the surface currents in the west Indian Ocean. Permanent currents are in black. Currents flowing during the summer monsoon are in red. Those flowing during the winter monsoon are in green. SC: Somali Current (reverses between the summer and the winter monsoon); SECC: South Equatorial Counter Current; SEC: South Equatorial Current; NEMC: Northeast Madagascar Current; SEMC: Southeast Madagascar Current; EACC: East African Coast Current; MC: Mozambique Current; Agulhas Current. Details of the whole Indian ocean circulation can be found in [54]. Ocean circulation is markedly different in the northern and southern Indian basins. In the southern hemisphere, circulation is rather stable throughout the year, being organized around an anticyclonic subtropical gyre, and driven by southeast trade winds in the tropics and westerlies in the middle latitudes. On the northern flank of the gyre, the South Equatorial Current (SEC) flows westward within a broad latitude range (sometimes up to 6°S, down to 25°S). It brings surface water all the way from Indonesia to the Madagascar east coast, where it splits into a northward branch (the Northeast Madagascar Current –NEMC) and a southward one (the Southeast Madagascar Current –SEMC). The NEMC flows past Cape Amber (the northern tip of Madagascar), and then feeds both the northward-flowing East African Coast Current (EACC) and the southward-flowing Mozambique Current (MC). The flow through the Mozambique Channel is characterized by an intense mesoscale activity, dominated by large anticyclonic eddies propagating southward along the Mozambique coastline. The associated mean flow is indeed southward, but the variability is large and northward transport events are not unusual (e.g., [93]). The SEMC flows southward along the East coast of Madagascar, and then becomes more turbulent, generating eddies that can either recirculate eastward around the South Indian subtropical gyre, or move westward towards the African coast, merging into the MC, and then the Agulhas Current (AC). As this current flows past the Cape of Good Hope, it can shed eddies that will then circulate into the South Atlantic Ocean, or retroflect into the Indian Ocean, and feed into the South Indian current. Circulation in the Northern hemisphere has a much stronger seasonal variability, governed by a monsoon regime with winds blowing from the southwest during summer, and reversing to the northeast during the winter monsoon. Consequently, the Somali Current (SC) flows northward during the summer monsoon. It can reach up to the Socotra Island, eventually forming some gyres. During the winter monsoon, the SC reverses, flowing southward down to about 3°S, where it meets the EACC. These two currents feed the seasonal eastward flowing South Equatorial Countercurrent (SECC). In the equatorial band itself, a singular phenomenon (not detailed here) causes surface currents to reverse direction (eastward/westward) four times a year.
Figure A2
Figure A2
Granitic islands group dispersal map. One-year long trajectories of 10,000 particles released from a 0.25° × 0.25° areas central to Granitic Group (with circle) from 2002 to 2006 (for a total of 50,000 particles). The color indicates the density of particles in number of turtles per day (log scale).
Figure A3
Figure A3
Amirantes group dispersal map. One-year long trajectories of 10,000 particles released from a 0.25° × 0.25° areas central to the Amirantes group (with circle) from 2002 to 2006 (for a total of 50,000 particles). The color indicates the density of particles in the number of turtles per day (log scale).
Figure A4
Figure A4
Glorieuses dispersal map. One-year long trajectories of 10,000 particles released from a 0.25° × 0.25° areas located about 40 km off the main nesting beaches of Glorieuses (with circle) from 2002 to 2006 (for a total of 50,000 particles). The color indicates the density of particles in number of turtles per day (log scale).
Figure A5
Figure A5
Mayotte dispersal map. One-year long trajectories of 10,000 particles released from a 0.25° × 0.25° areas located about 40 km off the main nesting beaches of Mayotte (with circle) from 2002 to 2006 (for a total of 50,000 particles). The color indicates the density of particles in number of turtles per day (log scale).
Figure A6
Figure A6
Mohéli dispersal map. One-year long trajectories of 10,000 particles released from a 0.25° × 0.25° areas located about 40 km off the main nesting beaches of Mohéli (with circle) from 2002 to 2006 (for a total of 50,000 particles). The color indicates the density of particles in number of turtles per day (log scale).
Figure A7
Figure A7
Europa dispersal map. One-year long trajectories of 10,000 particles released from a 0.25° × 0.25° areas located about 40 km off the main nesting beaches of Europa (with circle) from 2002 to 2006 (for a total of 50,000 particles). The color indicates the density of particles in number of turtles per day (log scale).
Figure A8
Figure A8
Tromelin dispersal map. One-year long trajectories of 10,000 particles released from a 0.25° × 0.25° areas located about 40 km off the main nesting beaches of Tromelin (with circle) from 2002 to 2006 (for a total of 50,000 particles). The color indicates the density of particles in number of turtles per day (log scale).
Figure A9
Figure A9
Simulated MSA. Graphs showing the proportional contributions estimated by BAYES (gray) from ten genetic stocks across the south Atlantic (Central Brazil, CB; South Brazil, SB; Ascension Is, AI; Bioko, BI; Sao Tome and Principe, STP), Southwest Indian Ocean (South; Central; North), and Cocos (Keeling) Islands, CKI to a hypothesized foraging aggregation. The simulated “true” value (black) of the composition represents 75% from the South, 20% from the Central, and 5% from the North Areas of the SWIO, with no contribution from Atlantic stocks and Cocos (Keeling) Islands.
Figure 1
Figure 1
Location map. Locations of 15 green turtle (Chelonia mydas) nesting locations and eight foraging sites included in the mixed stock analysis (MSA). Black dots represent individual rookeries, and shaded squares define three genetically distinct groupings (stocks) used as our baseline. Foraging locations are represented by squares. The bar graph shows the mean relative contribution of North; Granitics and Amirantes, Central; Kenya, Aldabra, Cosmoledo, Vamizi, Mohéli, Mayotte, Glorieuses, Iranja and Tromelin; South; Juan de Nova and Europa and CKI, Cocos (Keeling) Islands, to each of the eight developmental sites (CKI not shown on the map). The 95% confidence interval (CI) can be found in Table 2. Estimates are based on the mixed stock analysis using the many-to-many package in “R”, and using the population size as weighted priors.
Figure 2
Figure 2
Dispersal from rookeries. Small maps show the density distributions of juveniles emerging from the seven simulated nesting areas (Colors indicate the number of particles). The three central maps show the proportional distribution of juvenile turtles from each Area (North, Central and South) based on Bayesian “rookery-centric” estimates using the many to many mixed stock analysis.
Figure 3
Figure 3
Schematic heatmap of pairwise similarity between drifting trajectories patterns of modeled particles from seven green turtle rookeries of the South West Indian Ocean. Light yellow/Intense red represents low/high similarity between drifting patterns. Drifting patterns similarities were computed as the opposite of the Euclidean distance between drifting density matrices.

Similar articles

Cited by

References

    1. Treml E.A., Halpin P.N., Urban D.L., Pratson L.F. Modeling population connectivity by ocean currents, a graph-theoretic approach for marine conservation. Landsc. Ecol. 2007;23:19–36. doi: 10.1007/s10980-007-9138-y. - DOI
    1. Hays G.C. Ocean currents and marine life. Curr. Biol. 2017;27:R470–R473. doi: 10.1016/j.cub.2017.01.044. - DOI - PubMed
    1. Block B.A., Jonsen I.D., Jorgensen S.J., Winship A.J., Shaffer S.A., Bograd S.J., Hazen E.L., Foley D.G., Breed G.A., Harrison A.L., et al. Tracking apex marine predator movements in a dynamic ocean. Nature. 2011;475:86–90. doi: 10.1038/nature10082. - DOI - PubMed
    1. Hart K.M., Hyrenbach K.D. Satellite telemetry of marine megavertebrates: The coming of age of an experimental science. Endanger. Species Res. 2010;10:9–20. doi: 10.3354/esr00238. - DOI
    1. Lalire M., Gaspar P. Modeling the active dispersal of juvenile leatherback turtles in the North Atlantic Ocean. Mov. Ecol. 2019;7:1–17. doi: 10.1186/s40462-019-0149-5. - DOI - PMC - PubMed

Publication types

Substances

LinkOut - more resources