. 2020 Mar 5;21(5):1787.
doi: 10.3390/ijms21051787.

Modulation of Energy Metabolism Is Important for Low-Oxygen Stress Adaptation in Brassicaceae Species

Affiliations

Modulation of Energy Metabolism Is Important for Low-Oxygen Stress Adaptation in Brassicaceae Species

Ji-Hye Hwang et al. Int J Mol Sci. .

Abstract

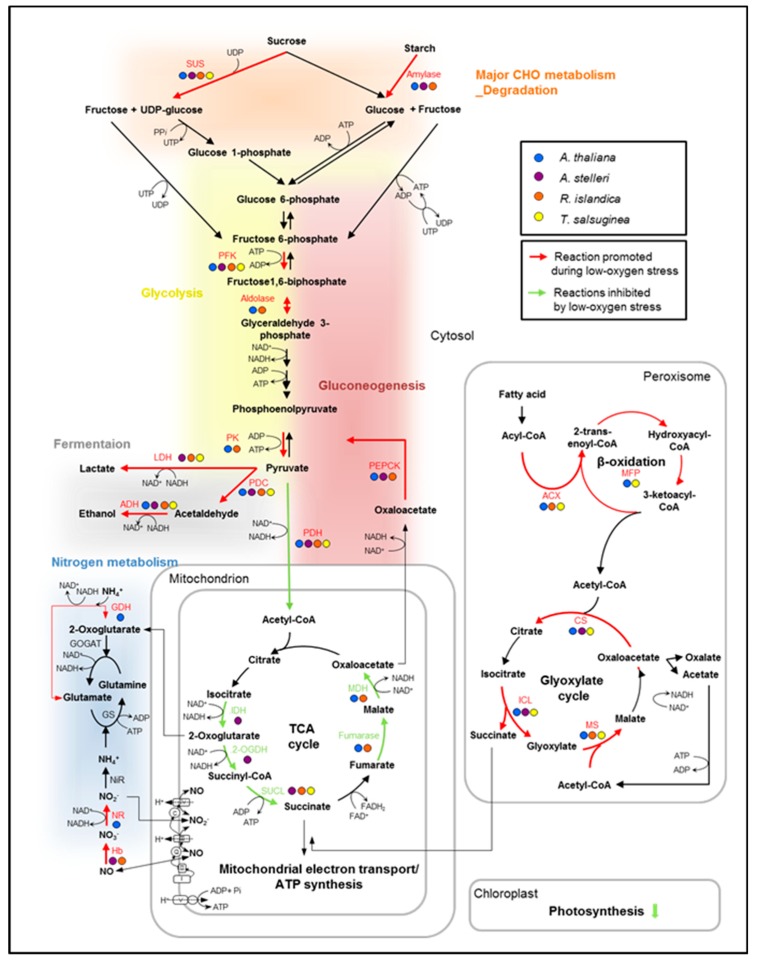
Low-oxygen stress, mainly caused by soil flooding, is a serious abiotic stress affecting crop productivity worldwide. To understand the mechanisms of low-oxygen stress responses and adaptation of plants, we characterized and compared low-oxygen responses in six species with different accessions of the Brassicaceae family. Based on the growth and survival responses to submergence or low-oxygen condition, these accessions could be divided into three groups: (i) Highly tolerant species (Rorippa islandica and Arabis stelleri); (ii) moderately tolerant species (Arabidopsis thaliana [esk-1, Ler, Ws and Col-0 ecotype]); and (iii) intolerant species (Thlaspi arvense, Thellungiella salsuginea [Shandong and Yukon ecotype], and Thellungiella parvula). Gene expression profiling using Operon Arabidopsis microarray was carried out with RNA from roots of A. thaliana (Col-0), A. stelleri, R. islandica, and T. salsuginea (Shandong) treated with low-oxygen stress (0.1% O2/99.9% N2) for 0, 1, 3, 8, 24, and 72 h. We performed a comparative analysis of the gene expression profiles using the gene set enrichment analysis (GSEA) method. Our comparative analysis suggested that under low-oxygen stress each species distinctively reconfigures the energy metabolic pathways including sucrose-starch metabolism, glycolysis, fermentation and nitrogen metabolism, tricarboxylic acid flow, and fatty acid degradation via beta oxidation and glyoxylate cycle. In A. thaliana, a moderately tolerant species, the dynamical reconfiguration of energy metabolisms occurred in the early time points of low-oxygen treatment, but the energy reconfiguration in the late time points was not as dynamic as in the early time points. Highly tolerant A. stelleri appeared to have high photosynthesis capacity that could produce more O2 and in turn additional ATP energy to cope with energy depletion caused by low-oxygen stress. R. islandica seemed to retain some ATP energy produced by anaerobic energy metabolism during a prolonged period of low-oxygen conditions. Intolerant T. salsuginea did not show significant changes in the expression of genes involved in anaerobic energy metabolisms. These results indicate that plants developed different energy metabolisms to cope with the energy crisis caused by low-oxygen stress.

Keywords: Brassicaceae; energy metabolism; gene set enrichment analysis (GSEA); hypoxia; low oxygen.


Conflict of interest statement

The authors declare that the research was conducted in the absence of any commercial or financial relationships that could be construed as a potential conflict of interest.

Figures

Figure 1
Figure 1
Comparison of tolerance to low-oxygen stress of A. thaliana and closely related species. (A) Morphology of six species with different accessions after submergence treatment. Three-week-old Arabidopsis and four-week-old closely related species, similar in development stage (immediately before bolting), in pots were entirely submerged for 7 days. Photographs were taken after recovery for 7 days. The survival rate was measured after 7 days of recovery. One pot contained more than 15 plants, and each experiment was repeated three times. (B) Morphology of six species with different accessions after low-oxygen gas treatment. Two-week-old Arabidopsis and three-week-old closely related species on agar plates, with three to four leaves at a similar development stage, were exposed to a low oxygen gas mixture (0.1% O2/99.9% N2) for 5 days. Photographs were taken after 3 days of recovery. The survival rate was measured after 3 days of recovery. One plate contained more than 20 plants, and each experiment was repeated three times. Bars represent the mean (three times) ±standard deviation. In the comparison between the survival rate of A. thaliana and each species, one asterisk (*) indicates p < 0.05; double asterisks (**), p < 0.01; and triple asterisks (***), p < 0.001.
Figure 2
Figure 2
Hierarchical cluster of gene expression patterns in the four species. Gene expression patterns of A. thaliana, R. islandica, A. stelleri, and T. salsuginea (Shandong) under normal conditions (A) or low-oxygen stress (B) were clustered by Euclidean distance. Logarithmic scales indicating the color assigned to each fold change are shown to the right of cluster. LT: low-oxygen treatment.
Figure 3
Figure 3
The gene sets enriched in the low-oxygen stress response of the four species. (A) The number of gene sets enriched in low-oxygen stress response. The gene expressions of each species under low-oxygen stress and normal conditions were analyzed by GSEA using a MapMan-based gene set database. (B) Graphical tree map of MapMan-based gene sets. (C) The positions of gene sets enriched in pairwise comparisons of A. thaliana and each of three closely related species on a graphical tree map of MapMan-based gene sets. For each species, gene sets enriched to low-oxygen stress at early time points (1 and 3 h) or late time points (24 and 72 h) were indicated on a graphical tree map. Red indicates positively enriched gene sets, and green indicates negatively enriched gene sets in pairwise comparisons. (B) is the legend for (C). To see the global patterns in (C), the group of small boxes in (B) should be virtually superimposed onto (C). One can compare the overall patterns of color bars in the matched boxes among the species.
Figure 4
Figure 4
Reconfiguration of energy metabolisms in response to low-oxygen stress at the level of gene set. The regulation of energy metabolism-related gene sets was analyzed from the GSEA results of A. thaliana, A. stelleri, R. islandica, or T. salsuginea. The red box represents upregulation and green box represents downregulation. Asterisks indicate normalized levels compared to the gene expression of A. thaliana under normal conditions.
Figure 5
Figure 5
Changes in root temperature of the four species under low-oxygen stress. Five-week-old A. thaliana and closely related species were exposed to a low oxygen gas mixture (0.1% O2/99.9% N2) for 12 h. (A) Bright-field images of the four species. The dotted-line box indicates the position of an infrared image. (B) Infrared images of roots of untreated or low-oxygen-treated plants. The plus signs indicate temperature measuring positions. (C) Root temperatures were obtained from infrared images using ThermaCAM Quikplot software. Delta T (ΔT) is a change in temperature between the control and the low-oxygen-treated plants (ΔT = Ttest − Tcont). Bars represent the mean (three times) ± standard deviation. The level of statistical significance is also marked with one asterisk (*) if p < 0.05, two (**) if p < 0.01, three asterisk (***) if p < 0.001, and ns: not significant.
Figure 6
Figure 6
Hypothetical alterations of the metabolic pathways for ATP production in low-oxygen stress response. In the diagram, the metabolic changes caused by oxygen deprivation were characterized by comparing changes in the expression of genes that are involved in the energy-metabolic pathways. The transcript expression of key genes was compared in the low-oxygen stress response of the four species. The genes upregulated or downregulated at least two-fold in each species were indicated in the pathway. Red arrows indicate reactions that are commonly promoted during low-oxygen stress, and green arrows indicate reactions inhibited by low-oxygen stress. Abbreviations are as follows: 2-OGDH, 2-oxoglutarate dehydrogenase; ACS, acetyl-CoA synthase; ACX, acyl-CoA oxidase; ADH, alcohol dehydrogenase; CS, citrate synthase; FK, fructokinase; GDH, glutamate dehydrogenase; GOGAT, glutamine oxoglutarate aminotransferase; GS, glutamine synthase; Hb, hemoglobin; ICL, isocitrate lyase; IDH, isocitrate dehydrogenase; LDH, lactate dehydrogenase; MDH, malate dehydrogenase; MFP, multifunctional protein (in β-oxidation); MS, malate synthase; NiR, nitrite reductase; NR, nitrate reductase; PDC, pyruvate decarboxylase; PDH, pyruvate dehydrogenase; PEPCK, phosphoenolpyruvate carboxykinase; PFK, phosphofructokinase; PK, pyruvate kinase; SUCL, succinyl-CoA ligase; SUS, sucrose synthase.

Similar articles

Cited by

References

    1. Subbaiah C.C., Sachs M.M. Molecular and cellular adaptations of maize to flooding stress. Ann. Bot. 2003;91:119–127. doi: 10.1093/aob/mcf210. - DOI - PMC - PubMed
    1. Liu F., Vantoai T., Moy L.P., Bock G., Linford L.D., Quackenbush J. Global transcription profiling reveals comprehensive insights into hypoxic response in Arabidopsis. Plant Physiol. 2005;137:1115–1129. doi: 10.1104/pp.104.055475. - DOI - PMC - PubMed
    1. Sachs M.M., Freeling M., Okimoto R. The anaerobic proteins of maize. Cell. 1980;20:761–767. doi: 10.1016/0092-8674(80)90322-0. - DOI - PubMed
    1. Kennedy R.A., Rumpho M.E., Fox T.C. Anaerobic Metabolism in Plants. Plant Physiol. 1992;100:1. doi: 10.1104/pp.100.1.1. - DOI - PMC - PubMed
    1. Igamberdiev A.U., Hill R.D. Nitrate, NO and haemoglobin in plant adaptation to hypoxia: An alternative to classic fermentation pathways. J. Exp. Bot. 2004;55:2473–2482. doi: 10.1093/jxb/erh272. - DOI - PubMed