. 2020 Mar 5;12(3):597.
doi: 10.3390/cancers12030597.

mTOR and STAT3 Pathway Hyper-Activation is Associated with Elevated Interleukin-6 Levels in Patients with Shwachman-Diamond Syndrome: Further Evidence of Lymphoid Lineage Impairment

Affiliations

mTOR and STAT3 Pathway Hyper-Activation is Associated with Elevated Interleukin-6 Levels in Patients with Shwachman-Diamond Syndrome: Further Evidence of Lymphoid Lineage Impairment

Antonio Vella et al. Cancers (Basel). .

Abstract

Shwachman-Diamond syndrome (SDS) is a rare inherited bone marrow failure syndrome, resulting in neutropenia and a risk of myeloid neoplasia. A mutation in a ribosome maturation factor accounts for almost all of the cases. Lymphoid involvement in SDS has not been well characterized. We recently reported that lymphocyte subpopulations are reduced in SDS patients. We have also shown that the mTOR-STAT3 pathway is hyper-activated in SDS myeloid cell populations. Here we show that mTOR-STAT3 signaling is markedly upregulated in the lymphoid compartment of SDS patients. Furthermore, our data reveal elevated IL-6 levels in cellular supernatants obtained from lymphoblasts, bone marrow mononuclear and mesenchymal stromal cells, and plasma samples obtained from a cohort of 10 patients. Of note, everolimus-mediated inhibition of mTOR signaling is associated with basal state of phosphorylated STAT3. Finally, inhibition of mTOR-STAT3 pathway activation leads to normalization of IL-6 expression in SDS cells. Altogether, our data strengthen the hypothesis that SDS affects both lymphoid and myeloid blood compartment and suggest everolimus as a potential therapeutic agent to reduce excessive mTOR-STAT3 activation in SDS.

Keywords: Bone Marrow Failure Syndromes; STAT3; lymphocytes; mTOR.


Conflict of interest statement

The authors declare no conflict of interest.

Figures
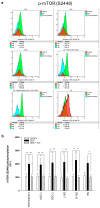
Figure 1
Figure 1
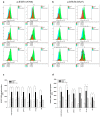
Phospho-flow analysis of mTOR S2448 in a panel of primary lymphocyte subsets. (a) Representative experiments conducted on peripheral blood samples obtained from patients with SDS. Red histograms represent age-matched healthy control cells; green histograms represent SDS lymphocytes; blue histograms represent SDS lymphocytes upon everolimus (350 nM) treatment. (b) Data are mean ± SEM of seven experiments conducted on SDS lymphocytes obtained from seven SDS patients (UPN37, UPN58, UPN69, UPN73, UPN87, UPN106, UPN108). Statistics: normal distribution was tested by the Shapiro–Wilk test. Subsequently, the Mann–Whitney Rank Sum Test was calculated. * p < 0.05; ** p < 0.01.
Figure 2
Figure 2
Phospho-flow analysis of STAT3 in a panel of primary lymphocyte subsets. (a) Representative analysis of phospho-STAT3 Y705 in lymphocyte subsets. (b) Representative analysis of phospho-STAT3 S727 in lymphocyte subsets. Red histograms represent age-matched healthy control cells; green histograms represent SDS patient-derived lymphocytes; blue histograms represent SDS lymphocytes upon everolimus (350nM) treatment. Data are mean ± SEM of seven experiments conducted on SDS patient-derived lymphocytes obtained from seven SDS patients (UPN37, UPN58, UPN69, UPN73, UPN87, UPN106, UPN108). Statistical Student’s t test for paired data has been calculated. * p < 0.05; ** p < 0.01. (c) STAT3 (Y705) Median Fluorescence Intensity as measured by phospho-flow assays. (d) STAT3 (S727) Median Fluorescence Intensity as measured by phospho-flow assays. Data are mean ± SEM of seven experiments conducted on SDS lymphocytes obtained from seven SDS patients (UPN37, UPN58, UPN69, UPN73, UPN87, UPN106, UPN108). Statistics: Normal distribution was tested by the Shapiro–Wilk test. Subsequently, the Mann–Whitney Rank Sum Test was calculated. * p < 0.05; ** p < 0.01.
Figure 3
Figure 3
STAT3 transcript and protein expression is upregulated in SDS patient-derived LCL. (a) STAT3 mRNA expression in LCL isolated from UPN6, UPN43, UPN58, UPN82 (black bar), and from age-matched controls (white bar), measured by qRT-PCR. Data are mean ± SEM of four experiments performed in duplicate. (b) STAT3 protein level was measured in LCL (UPN6, UPN43, UPN58, UPN82) by Western blot analysis. (c,d) Densitometric analysis of Western blots showed in panel (b). Statistics: Normal distribution was tested by the Shapiro–Wilk test. Subsequently, the Mann–Whitney Rank Sum Test was calculated and reported within histograms.
Figure 4
Figure 4
STAT3 transcript and protein expression is upregulated in SDS patient-derived primary PBMC. (a) STAT3 mRNA expression in primary PBMC isolated from UPN26, UPN69, UPN73, UPN87, UPN94, UPN106, and UPN108 (black bar), and from age-matched controls (white bar), measured by qRT-PCR. Data are mean ± SEM of seven experiments. (b) STAT3 protein level was measured in PBMC (UPN52 and UPN74) by Western blot analysis. (c) Densitometric analysis of Western blots showed in panel b. Statistics: Normal distribution was tested by the Shapiro–Wilk test. Subsequently, the Mann-Whitney Rank Sum Test was calculated and reported within histograms.
Figure 5
Figure 5
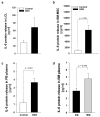
IL-6 release is elevated in SDS specimens compared to age-matched donor controls. (a) Measurement of IL-6 released in supernatants collected from 1 × 10⁶ LCL after 48h. Data are mean ± SEM of 10 experiments conducted on LCL obtained from UPN24, UPN26, UPN58, UPN68, UPN75, and UPN106. (b) IL-6 released in supernatants collected from 2 × 10⁵ primary BM-MSC after 48 h. (c) IL-6 concentration in peripheral blood (PB) plasma samples obtained from 21 patients with SDS (UPN1, 13, 26, 37, 47, 52, 56, 57, 58, 63, 65, 66, 69, 72, 73, 74, 87, 94, 104, 106, 108) compared with age-matched plasma controls. (d) IL-6 concentration in bone marrow (BM) plasma samples obtained from eight patients with SDS (UPN 47, 56, 65, 74, 87, 94, 106, 108) compared to PB plasma samples obtained from the same patients. Normal distribution was tested by the Shapiro–Wilk test. The Mann–Whitney Rank Sum Test was calculated and reported within histograms.
Figure 6
Figure 6
sIL6-R release is reduced in patients with SDS. (a) sIL-6R protein release was quantified by ELISA in PB plasma samples obtained from 21 patients with SDS (UPN 1, 13, 26, 37, 47, 52, 56, 57, 58, 63, 65, 66, 69, 72, 73, 74, 87, 94, 104, 106, 108) compared with age-matched plasma controls. (b) sIL-6R concentration in BM plasma samples obtained from eight patients with SDS (UPN 47, 56, 65, 74, 87, 94, 106, 108) compared with PB plasma samples obtained from the same patients. Normal distribution was tested by the Shapiro–Wilk test. The Mann–Whitney Rank Sum Test was calculated and reported within histograms.
Figure 7
Figure 7
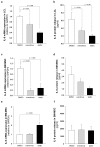
Everolimus and stattic inhibit IL-6 expression in SDS patient-derived hematopoietic cells. (a) IL-6 transcript expression in LCL incubated in the absence (DMSO) or in the presence of 350 nM everolimus or 7.5 μM stattic for 24 h was quantified by qRT-PCR. Data are mean ± SEM of six experiments performed in duplicate from three affected individuals (UPN58, UPN75, and UPN106). (b) IL-6 release in supernatants collected from LCL incubated in the absence (DMSO) or in the presence of 350 nM everolimus or 7.5 μM stattic for 24 h, as measured by Bio-plex assay. Data are mean ± SEM of six experiments conducted as reported in panel a. (c) IL-6 mRNA expression in primary BM-MNC incubated in the absence (DMSO) or in the presence of 350 nM everolimus or 7.5 μM stattic for 24 h was quantified by qRT-PCR. Data are mean ± SEM of four experiments performed in duplicate from four affected individuals (UPN74, UPN80, UPN94, and UPN106). (d) IL-6 release in supernatants collected from BM-MNC as measured by Bio-plex assay. Data are mean ± SEM of four experiments conducted as reported in panel c. (e) IL-6 transcript expression in BM-MSC incubated in the absence (DMSO) or in the presence of 350 nM everolimus or 7.5 μM stattic for 24 h was quantified by qRT-PCR. Data are mean ± SEM of four experiments performed in duplicate from four affected individuals (UPN33, UPN35, UPN67 and UPN91). (f) IL-6 release in supernatants collected from BM-MSC (UPN33, UPN35, UPN67 and UPN91) as measured by Bio-plex assay. Data are mean ± SEM of four experiments conducted as reported in panel e. Statistics: Normal distribution was tested by the Shapiro–Wilk test, and the Student’s t test for paired data has been calculated and reported within histograms, accordingly.
Figure 8
Figure 8
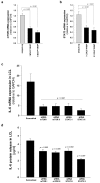
STAT3 and mTOR gene silencing inhibit IL-6 expression in LCL from SDS patients. (a) Reduced expression of mTOR mRNA after siRNA-mediated gene silencing. LCL obtained from UPN58, UPN75 and UPN106 were cultured with two different siRNA sequences against target genes, or scrambled sequence (negative control for 48 h). Data are mean ± SEM of four experiments performed in duplicate. (b) Reduced expression of STAT3 mRNA after siRNA-mediated gene silencing in LCL, as performed in panel a. Data are mean ± SEM of four experiments performed in duplicate. (c) IL-6 mRNA expression in LCL treated as indicated in panels (a) and (b). (d) IL-6 release was measured by Bio-plex assay in supenatants obtained from LCL treated as indicated in a. Statistics: Normal distribution was tested by the Shapiro–Wilk test. Subsequently, the Mann–Whitney Rank Sum Test was calculated and reported within histograms.

Similar articles

Cited by

References

    1. Dror Y., Donadieu J., Koglmeier J., Dodge J., Toiviainen-Salo S., Makitie O., Kerr E., Zeidler C., Shimamura A., Shah N., et al. Draft consensus guidelines for diagnosis and treatment of shwachman-diamond syndrome. Ann. N Y Acad. Sci. 2011;1242:40–55. doi: 10.1111/j.1749-6632.2011.06349.x. - DOI - PubMed
    1. Kargas V., Castro-Hartmann P., Escudero-Urquijo N., Dent K., Hilcenko C., Sailer C., Zisser G., Marques-Carvalho M.J., Pellegrino S., Wawiórka L., et al. Mechanism of completion of peptidyltransferase centre assembly in eukaryotes. Elife. 2019;8:e44904. doi: 10.7554/eLife.44904. - DOI - PMC - PubMed
    1. Weis F., Giudice E., Churcher M., Jin L., Hilcenko C., Wong C.C., Traynor D., Kay R.R., Warren A.J. Mechanism of eif6 release from the nascent 60s ribosomal subunit. Nat. Struct. Mol. Biol. 2015;22:914–919. doi: 10.1038/nsmb.3112. - DOI - PMC - PubMed
    1. Finch A.J., Hilcenko C., Basse N., Drynan L.F., Goyenechea B., Menne T.F., González Fernández A., Simpson P., D’Santos C.S., Arends M.J., et al. Uncoupling of gtp hydrolysis from eif6 release on the ribosome causes shwachman-diamond syndrome. Genes Dev. 2011;25:917–929. doi: 10.1101/gad.623011. - DOI - PMC - PubMed
    1. Corey S.J., Minden M.D., Barber D.L., Kantarjian H., Wang J.C., Schimmer A.D. Myelodysplastic syndromes: The complexity of stem-cell diseases. Nat. Rev. Cancer. 2007;7:118–129. doi: 10.1038/nrc2047. - DOI - PubMed

LinkOut - more resources