. 2020 Mar 10:9:e50155.
doi: 10.7554/eLife.50155.

Structural model for differential cap maturation at growing microtubule ends

Affiliations

Structural model for differential cap maturation at growing microtubule ends

Juan Estévez-Gallego et al. Elife. .

Abstract

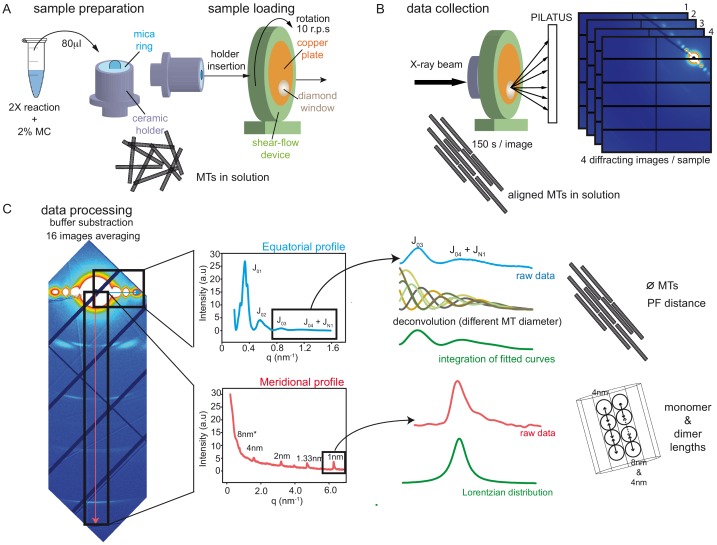
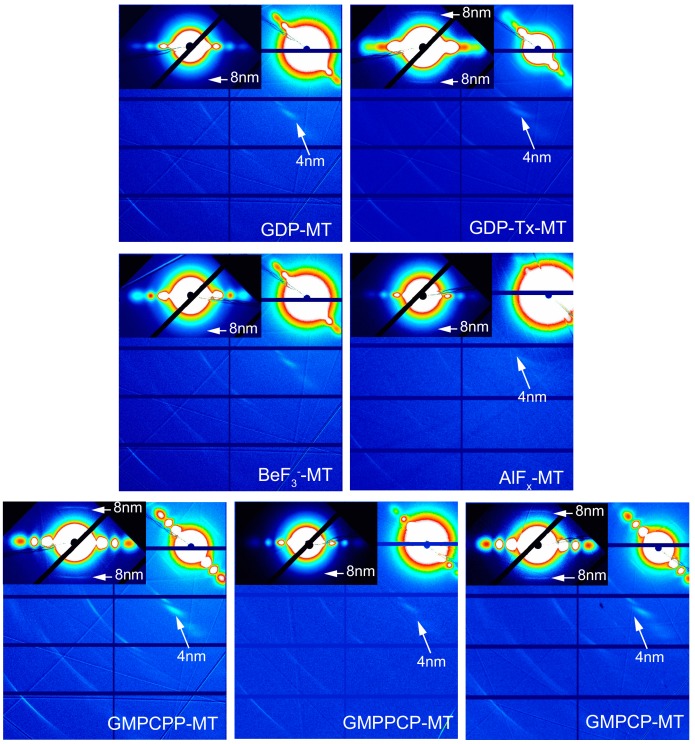
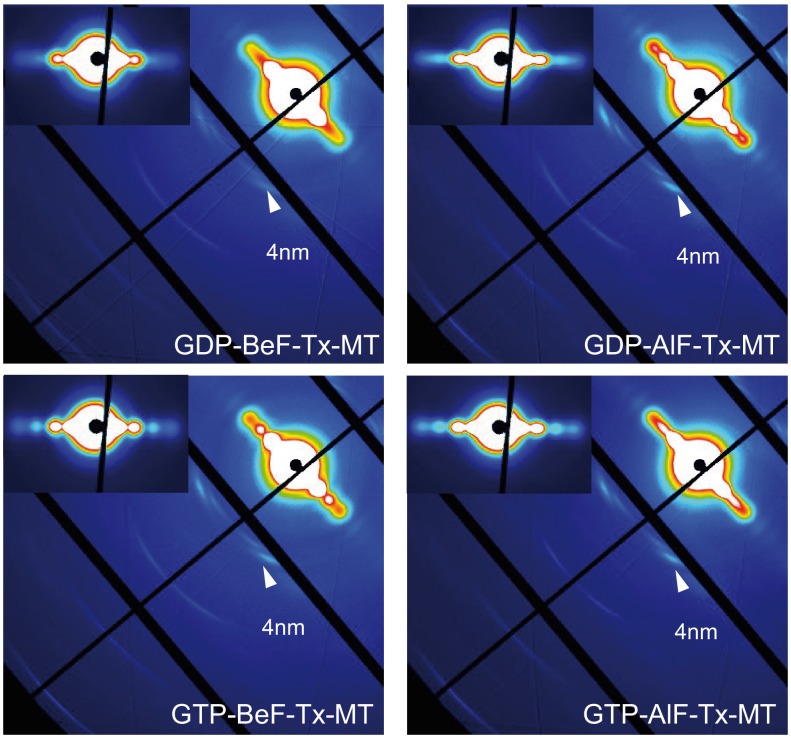
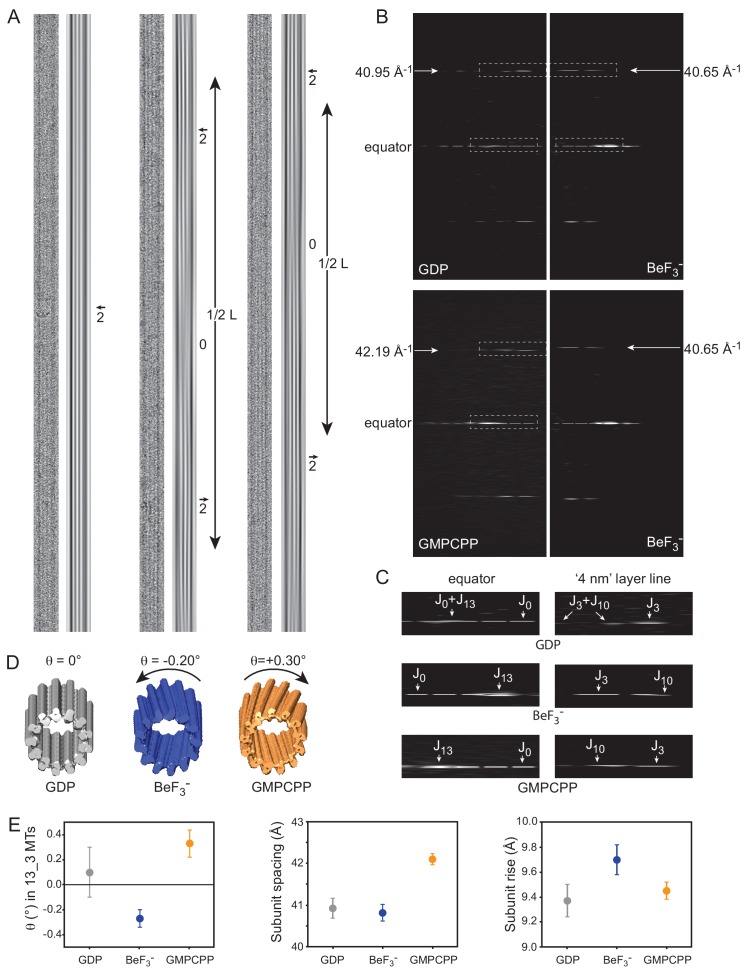
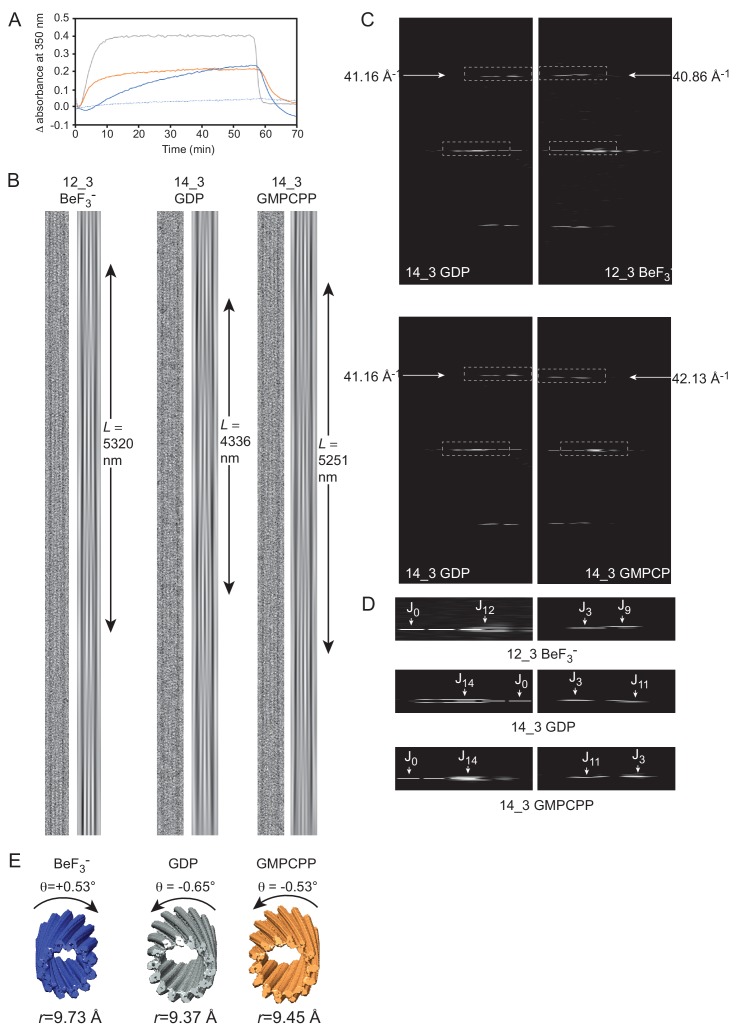
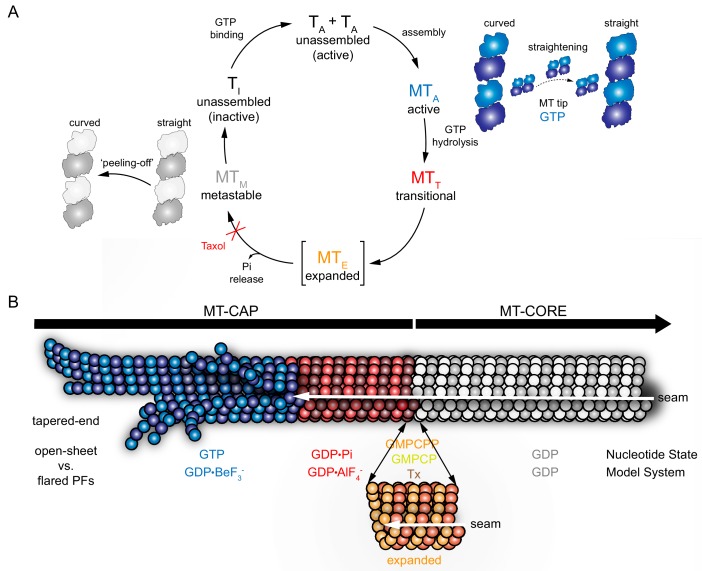
Microtubules (MTs) are hollow cylinders made of tubulin, a GTPase responsible for essential functions during cell growth and division, and thus, key target for anti-tumor drugs. In MTs, GTP hydrolysis triggers structural changes in the lattice, which are responsible for interaction with regulatory factors. The stabilizing GTP-cap is a hallmark of MTs and the mechanism of the chemical-structural link between the GTP hydrolysis site and the MT lattice is a matter of debate. We have analyzed the structure of tubulin and MTs assembled in the presence of fluoride salts that mimic the GTP-bound and GDP•Pi transition states. Our results challenge current models because tubulin does not change axial length upon GTP hydrolysis. Moreover, analysis of the structure of MTs assembled in the presence of several nucleotide analogues and of taxol allows us to propose that previously described lattice expansion could be a post-hydrolysis stage involved in Pi release.

Keywords: GTP-cap; dynamic instability; microtubule; molecular biophysics; none; structural biology; taxol.


Conflict of interest statement

JE, FJ, SK, RB, FB, AP, DL, CK, TY, HI, LD, IB, MS, DC, SK, JD, MO No competing interests declared

Figures

Figure 1.
Figure 1.. Structure of tubulin bound to GDP-phosphate analogues.
(A) The T2R-TTL complex includes one RB3 molecule (orange), one TTL molecule (pink) and two tubulin heterodimers: α-tubulin (dark gray, GTP-bound, chains A and C), β-tubulin (light gray, GDP-bound, chains B and D). (B) Composite omits maps of BeF3- (left) and AlF3 (middle and right): mFo-DFc maps (blue, contour level 1.0) of nucleotide and Mg2+ ions combined with 2mFo-DFc maps (green, contour level 3.0) of the related phosphate analogues. (C) GTP (PDB 5xp3, black) and GDP- (PDB 4i55, gray) bound β-tubulin highlighting the localization of secondary structural elements surrounding the nucleotide-binding site according to Löwe et al. (2001) and alternative positions of T5 loop depending on the nucleotide-bound state. (D) Chain D alignment of GDP-BeF3- structure (blue) with GMPCPP-bound (PDB 3ryh, orange), GTP-bound (black) and GDP-bound (gray) structures showing BeF3-/γ-phosphates co-localization, differences on the position of Mg2+ ions depending on the nucleotide-bound state (4.5 Å apart), and T5 loop in a GTP-like (‘out’) conformation. (E) Chain B alignment of GDP-AlF3 (red) structure with GMPCPP-bound (orange) and GDP-bound (gray) structures highlighting that AlF3 sits out of the γ-phosphate site at 2.77 Å from the Mg2+ ion (in a position equivalent to that on the GDP-bound structure). (F) Chain D alignment of GDP-AlF3 (red) structure with GTP-bound (black) and GDP-bound (gray) structures showing the dual conformation of T5 loops.
Figure 2.
Figure 2.. Phosphate analogues sustain tubulin activation and MT stabilization.
(A) Time course assembly of 30 μM GDP-tubulin (gray line) with either 1 mM GTP (black line) or 1 mM GDP and increasing BeF3- concentrations (1 mM, 2 mM, 4 mM, 6 mM, 8 mM and 10 mM; from light to dark blue). (B) Critical concentration (Cr) measurements of GDP-tubulin with 1 mM GTP (black square) or 1 mM, 2 mM, 3 mM, 4 mM, 5 mM, 6 mM, 7 mM and 8 mM BeF3- (blue circles). (C) Wyman plots showing the effect of increasing Mg2+ concentrations (4 mM, 5 mM, and 6 mM) on tubulin assembly (37°C) in the presence of 1 mM GTP (black squares) or 1 mM GDP plus 3 mM BeF3- (blue circles). Positive slopes indicate that at increasing Mg2+ concentrations the ion incorporation into the filament is higher, and similar slope values (under BeF3- and GTP) indicate a similar Mg2+ dependency of the polymerization. (D) Time course assembly of 30 μM GDP-tubulin with either 1 mM GTP (black line) or 1 mM GDP, 3 mM HKF2 and increasing concentrations of AlCl3 (0 μM, 50 μM, 100 μM, 250 μM, 500 μM and 1 mM; from light to dark red). (E) Time course assembly of 30 μM tubulin in the absence of free GTP (black line) and in the presence of increasing concentrations of BeF3- (100 nM, 500 nM, 1 μM, 10 μM and 50 μM; from light to dark blue) showing the stabilization effect of the analogue. (F) Time course assembly of 30 μM tubulin in the absence of free GTP and 0 mM HKF2 (black line) or in the absence of free GTP with 3 mM HKF2 and increasing concentrations of AlCl3 (0 μM, 50 μM, 100 μM, 250 μM, 500 μM and 1 mM from light to dark red). Aluminum contamination in nucleotides and glass induce MT stabilization even when no AlCl3 was added (light red). Arrows in graphs (A), (D), (E), and (F) indicate when samples were incubated at 4°C.
Figure 2—figure supplement 1.
Figure 2—figure supplement 1.. Electron micrographs of MTs polymerized in the presence of BeF3- and AlFx.
(A) Electron micrograph of MTs grown in the presence of GDP-tubulin and 6 mM BeF3-. The inset shows length estimations of MTs (units are μm, n > 50) from samples containing 30 μM GDP-tubulin with 2 mM, 4 mM, and 6 mM BeF3- (blue circles), or 1 mM GTP (black square). (B) Electron micrograph of MTs grown in the presence of GDP-tubulin with 3 mM HKF2 and 1 mM AlCl3. Bar is 200 nm.
Figure 3.
Figure 3.. Fiber diffraction of MT models systems.
GDP-BeF3--MT (blue), GDP-AlFx-MT (red), GMPPCP-MT (salmon), GMPCP-MT (yellow), GMPCPP-MT (orange), GDP-Tx-MT (brown) and GDP-MT (gray). (A) Top; representative image (GMPCPP-MTs) of meridional diffraction displaying the meridional plane from l = 1 (4nm) layer line and related harmonics (l = 2 to 4) for longitudinal metric calculations. Bottom; meridional intensity patterns, where arrows indicate the 4 nm and 8 nm peaks. The inset shows the best fit of 1 nm band experimental intensities in a Lorentzian normal distribution, highlighting positional differences between all tested MT growing conditions (peaks maxima, arrows). (B) Top; representative image (GMPCPP-MTs) of equatorial diffraction highlighting the equatorial plane (l = 0) for lateral metric calculations. Bottom; equatorial intensity patterns showing the corresponding Bessel functions from J01 to J04+JN1. The inset shows the JN1, calculated as described in M and M, displaying the differences in peak maxima (arrows) that occur under various nucleotide polymerization conditions. The red dash line on (A) and (B) top images shows planes used for intensity line plotting in qx space and further metric calculations. (C) Estimation of the number of PFs per MT and percentage of each subpopulation within the solution from fiber diffraction experiments (left) and cryo-EM images (right).
Figure 3—figure supplement 1.
Figure 3—figure supplement 1.. Shear-flow aligned fiber diffraction experiments.
(A) 2X samples were incubated at 37°C and mixed (1:1) with pre-warmed 2% methylcellulose. The mixture was displayed onto a mica ring set on a ceramic holder and was inserted into the shear-flow device. Temperature and rotation was remotely controlled. (B) The sample was exposed to the X-ray beam and small angle diffracting images coming from the diamond window were collected in a 1M PILATUS detector. With an exposure time of 150 s, we could collect a maximum of 4 images per sample before any sign of radiation damage. (C) Images were buffer subtracted and averaged for data analysis. Each dataset (with a minimum of 16 images) was analyzed for the equatorial and meridional signals. The intensity profile was measured along distance from the center of the diffraction and subsequently analyzed. The equatorial profiles allowed the estimation of the diameter of the MTs, the PF number and the inter-PF distances. To get this information the J03 and J04+JN1 signals were deconvolved according to MTs with different putative PF numbers and the fitted curves were integrated and correlated with the raw data. The meridional profile shows peaks at the 8 nm and/or the 4 nm families of layer lines. We calculated the Lorentzian distribution of the 1 nm line (a Bessel harmonic of the 4 nm) to find differences in the axial spacing between α- and β-tubulin.
Figure 3—figure supplement 2.
Figure 3—figure supplement 2.. Shear-flow aligned fiber diffraction images.
Dataset images from MTs assembled under different conditions, showing the meridional diffraction. Insets centered on the equatorial diffraction highlight the presence (GDP-Tx-, GMPCPP- and GMPCP-MTs) or absence (GDP-, BeF3--, AlFx- and GMPPCP-MTs) of the 8 nm layer line.
Figure 3—figure supplement 3.
Figure 3—figure supplement 3.. Shear-flow aligned fiber diffraction images of BeF3-- and AlFx-MTs in the presence of taxol.
All these dataset images show the presence of the 4 nm layer lines and the clear absence (inset) of the 8 nm layer line.
Figure 4.
Figure 4.. Cryo-EM of GDP-, BeF3--and GMPCPP-MTs.
(A) Straightened images of microtubules with 13 PFs (N) and 3-start monomer helices (S), denoted 13_3 (N_S) MTs. For each condition: raw image (left) and filtered image using the J0 and JN layer lines in the FFT of the MTs (right). Filtered images of 13_3 GDP-MTs display 2 dark inner fringes running parallel to the MT axis and slightly offset from it (arrow), which correspond to PFs from the top and bottom surfaces superposed in projection. In BeF3-- and GMPCPP-MTs, the 2 fringes make moiré patterns offset from the MT axis on one side and the other separated by blurred regions (noted ‘0’ for no internal fringes). The periodicity (L) of these moiré patterns provides a direct measure of their PF skew angle θ (Equation 8). (B) Comparison between the FFTs of the 13_3 GDP- vs. the 13_3 BeF3--MT (top), and the 13_3 GMPCPP- vs. the 13_3 BeF3--MT (bottom) in A. The monomer spacing along PFs (a in Equation 9) is given by the position of the J3 layer line in Fourier space, that is 40.95 Å, 40.65 Å, and 42.19 Å for the 13_3 GDP-, BeF3-- and GMPCPP-MTs in A, respectively. (C) Blow up of the equator and ‘4 nm layer lines’ in 13_3 GDP- (top), BeF3-- (middle) and GMPCPP-MTs (bottom), corresponding to the boxed regions in B. In 13_3 GDP-MTs, J0 and JN overlap on the equator, and J3 and J10 overlap on the ‘4 nm layer line’ since the PFs are parallel to the MT axis. In 13_3 BeF3-- and GMPCPP-MTs, J13 is away from the equator due to the PF skew. In BeF3--MTs, J10 is closer to the equator than J3, indicating that the PFs are left-handed (negative skew), while in GMPCPP-MTs, J10 is farther apart from the equator than J3, indicating that the PFs are right-handed (positive skew), (Chrétien et al., 1996). (D). 3D reconstructions of the 13_3 MTs in A using TubuleJ (Blestel et al., 2009). The 3D reconstructions were elongated to the same size as the original images and presented front face at a slight angle with respect to the MT longitudinal axis to emphasize the PF handedness in 13_3 GDP-MT (θ = 0°), BeF3--MT (θ = - 0.20°), and GMPCPP-MT (θ = + 0.30°). (E) Left: average PF skew angles of 13_3 GDP-MTs (θ = + 0.10 ± 20°, n = 15), BeF3--MTs (θ = - 0.27 ± 0.07°, n = 9), and GMPCPP-MTs (θ = + 0.33 ± 0.11°, n = 12). The average PF skew angle of 13_3 GDP_MTs must be lower since a majority of MTs did not show long enough moiré patterns that could be measured at the high magnification used. Therefore, their average PF skew angle is likely closer to 0°. Middle: average monomer spacing along PFs in GDP-MTs (a = 40.93 ± 0.24 Å, n = 66), BeF3--MTs (a = 40.82 ± 0.20 Å, n = 103), and GMPCPP-MTs (a = 42.10 ± 0.13 Å, n = 25). All N_S microtubule types were included in the analysis. Right: inter-PF monomer tubulin rise in GDP-MTs (r = 9.37 ± 0. 13 Å, n = 64), BeF3--MTs (r = 9.70 ± 0. 12 Å, n = 83), and GMPCPP-MTs (r = 9.45 ± 0. 07 Å, n = 24) determined using Equation 9. MTs with modified lateral interactions (essentially observed in 13_4 and 14_4 MTs in BeF3- conditions) were not included in this analysis (Chrétien and Fuller, 2000).
Figure 4—figure supplement 1.
Figure 4—figure supplement 1.. additional cryo-EM data.
(A) Turbidimetric analysis of MTs assembled in BRB80, 35°C, and in the presence of 1 mM GTP (tubulin concentration 40 μM, gray), 5 mM BeF3- (tubulin concentration 40 μM, dotted blue), 5 mM BeF3- in the presence of BeF3--MTs seeds (tubulin concentration 40 μM, blue), and 0.1 mM GMPCPP (tubulin concentration 10 μM, orange). In the presence of BeF3--MTs seeds, the turbidimetric curve drops below zero due to the depolymerization of the seeds. Note the lowest depolymerization rate of BeF3-- and GMPCPP-MTs with respect to GDP-MTs after switching to 4°C. (B) Comparison between 12_3 BeF3--, 14_3 GDP- and 14_3 GMPCPP-MTs. In each panel: left: raw straightened image; right: J0+JN filtered image. The moiré period L provides the absolute value of the PF slew angle according to Equation 8, that is 0.53°, 0.65° and 0.53° for 12_3 BeF3--, 14_3 GDP and 14_3 GMPCPP-MTs, respectively. (C). Top: FFTs of the 14_3 GDP- versus 12_3 BeF3--MTs in B. The monomer spacing along PFs is similar in the 14_3 GDP-MT (41.16 Å) and the 12_3 BeF3--MT (40.86 Å). Bottom: FFTs of the 14_3 GDP- versus 14_3 GMPCCP-MTs. The monomer spacing along PFs is lower in the 14_3 GDP-MT compared to the 14_3 GMPCPP-MT (42.13 Å). (D) Blow up of boxed regions in B. Top: 12_3 BeF3--MT; middle: 14_3 GDP-MT; bottom: 14_3 GMPCPP-MT. JN is systematically away from the equator since all MTs have skewed PFs. 12_3 BeF3--MTs have right-handed PFs since J9 is farther apart from the equator than J3, while 14_3 GDP- and GMPCPP-MTs have left-handed PFs since J11 is closer to the equator than J3. This analysis provides the sign of the PF skew angles, that is +0.53°, −0.65° and −0.53° for 12_3 BeF3--, 14_3 GDP- and 14_3 GMPCPP-MTs, respectively. (E) 3D reconstructions of the MTs in B presented face-on at a slight angle with respect to the MT axis to emphasize the PF skew. The inter-PF subunit rise r for each MT is given by Equation 9. 12_3 BeF3--MTs display a higher inter-PF subunit rise compared to GDP- and GMPCPP-MTs (see also Figure 4).
Figure 5.
Figure 5.. Cap model derived from MT model systems.
GTP-bound state (BeF3-, blue), transition state (AlFx, red), expanded state (GMPCPP, GMPCP, GDP-Tx, orange), and GDP-bound state (gray). (A) Schematic GTPase related conformational changes within the MT lattice. Tubulin activation upon GTP binding (TA) induces polymerization. During assembly (MTA), the formation of lateral contacts favors tubulin straightening, which allows GTP hydrolysis. GTPase activity drives MT through a transitional state (MTT), where the Pi is at the nucleotide-binding site before it is released. Expansion (orange) may be an intermediate transient step between GDP•Pi and GDP states, which may facilitates Pi release (MTE) and would be blocked in the presence of taxol. GDP-MT (MTM) shrinks through a ‘peeling-off’ disassembly in which tubulin reverts to the curved conformation, which is inactive (TI) in the GDP-bound state. (B) MT model illustrating specific lattice features of the GTPase cycle. This mosaic structure shows that: (i) the GTP-bound tip (blue) contains curved PFs/sheets that come together into a straight lattice due to the formation of lateral contacts, (ii) the post-hydrolysis GDP•Pi lattice (red) retains overall MT structure, (iii) hypothetically, lattice undergoes an energy-consuming expansion phase (orange) that contributes to Pi release, and (iv) in the GDP state (gray) subtle changes on the PF skew distinguish the metastable compact lattice or, (v) lattice reverts into its previous lower energy state (compaction), preventing the structure from returning to the cap architecture.

Comment in

  • doi: 10.7554/eLife.55460

References

    1. Adams PD, Afonine PV, Bunkóczi G, Chen VB, Davis IW, Echols N, Headd JJ, Hung LW, Kapral GJ, Grosse-Kunstleve RW, McCoy AJ, Moriarty NW, Oeffner R, Read RJ, Richardson DC, Richardson JS, Terwilliger TC, Zwart PH. PHENIX: a comprehensive Python-based system for macromolecular structure solution. Acta Crystallographica Section D Biological Crystallography. 2010;66:213–221. doi: 10.1107/S0907444909052925. - DOI - PMC - PubMed
    1. Alushin GM, Lander GC, Kellogg EH, Zhang R, Baker D, Nogales E. High-Resolution microtubule structures reveal the structural transitions in αβ-Tubulin upon GTP hydrolysis. Cell. 2014;157:1117–1129. doi: 10.1016/j.cell.2014.03.053. - DOI - PMC - PubMed
    1. Amos L, Klug A. Arrangement of subunits in flagellar microtubules. Journal of Cell Science. 1974;14:523–549. - PubMed
    1. Andreu JM, Bordas J, Diaz JF, García de Ancos J, Gil R, Medrano FJ, Nogales E, Pantos E, Towns-Andrews E. Low resolution structure of microtubules in solution. Synchrotron X-ray scattering and electron microscopy of taxol-induced microtubules assembled from purified tubulin in comparison with glycerol and MAP-induced microtubules. Journal of Molecular Biology. 1992;226:169–184. doi: 10.1016/0022-2836(92)90132-4. - DOI - PubMed
    1. Atheton J, Stouffer M, Francis F, Moores CA. Microtubule architecture in vitro and in cells revealed by cryo-electron tomography. Acta Crystallographica Section D. 2018;74(Pt 6):572–584. doi: 10.1107/S2059798318001948. - DOI - PMC - PubMed

Publication types