. 2020 Jul 1:214:116703.
doi: 10.1016/j.neuroimage.2020.116703. Epub 2020 Mar 6.

Registration-free analysis of diffusion MRI tractography data across subjects through the human lifespan

Affiliations

Registration-free analysis of diffusion MRI tractography data across subjects through the human lifespan

Viviana Siless et al. Neuroimage. .

Abstract

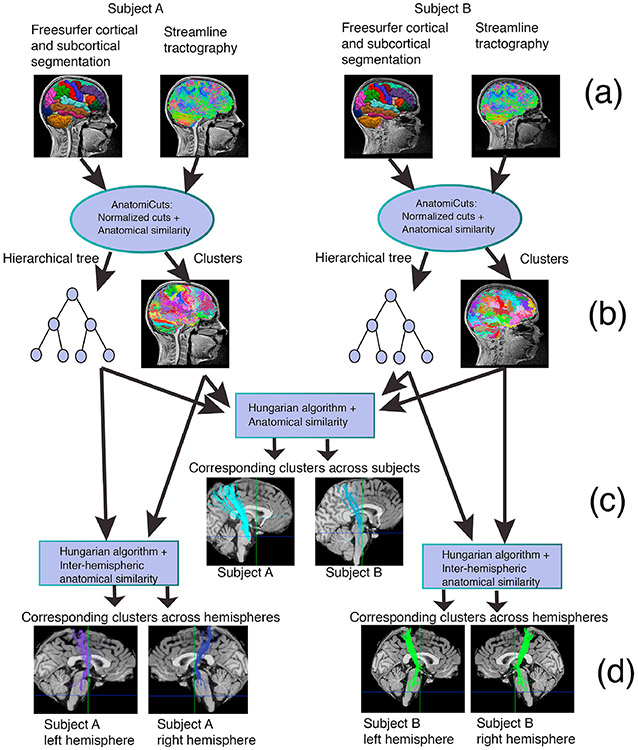
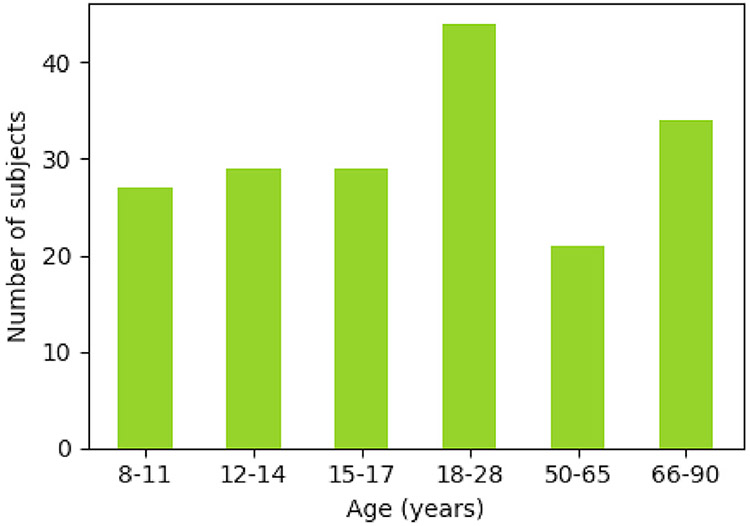
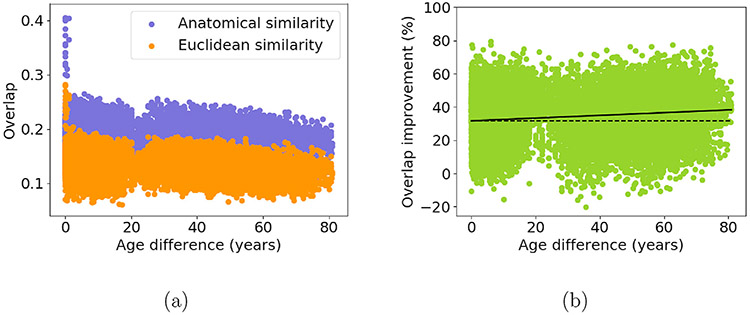
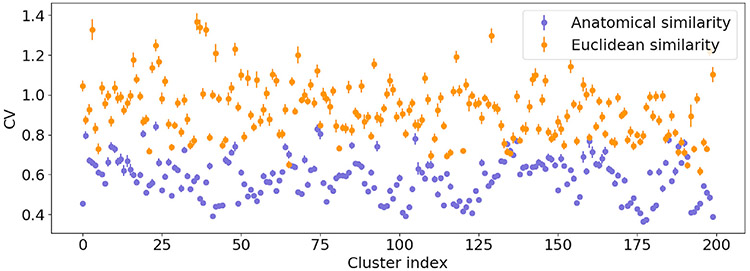
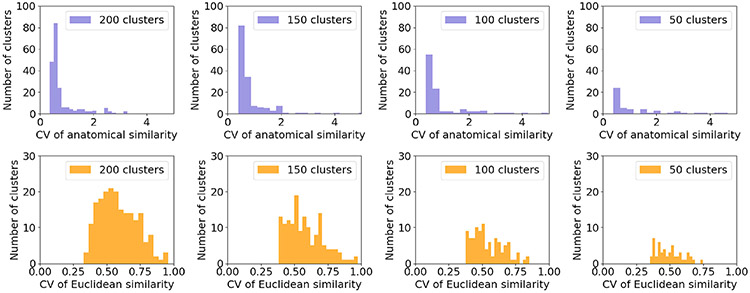
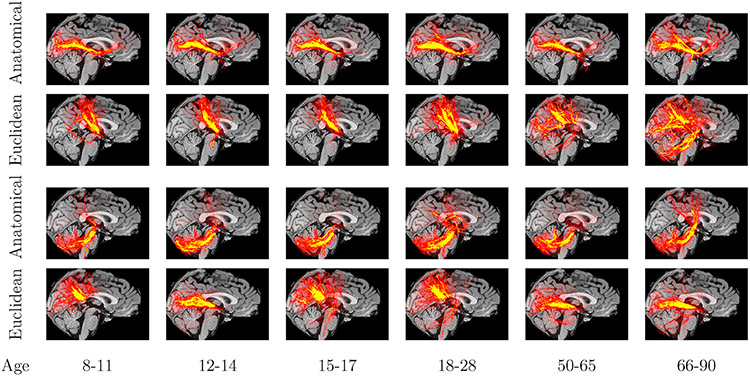
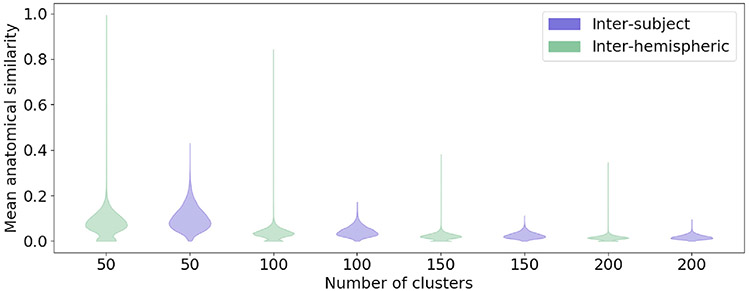
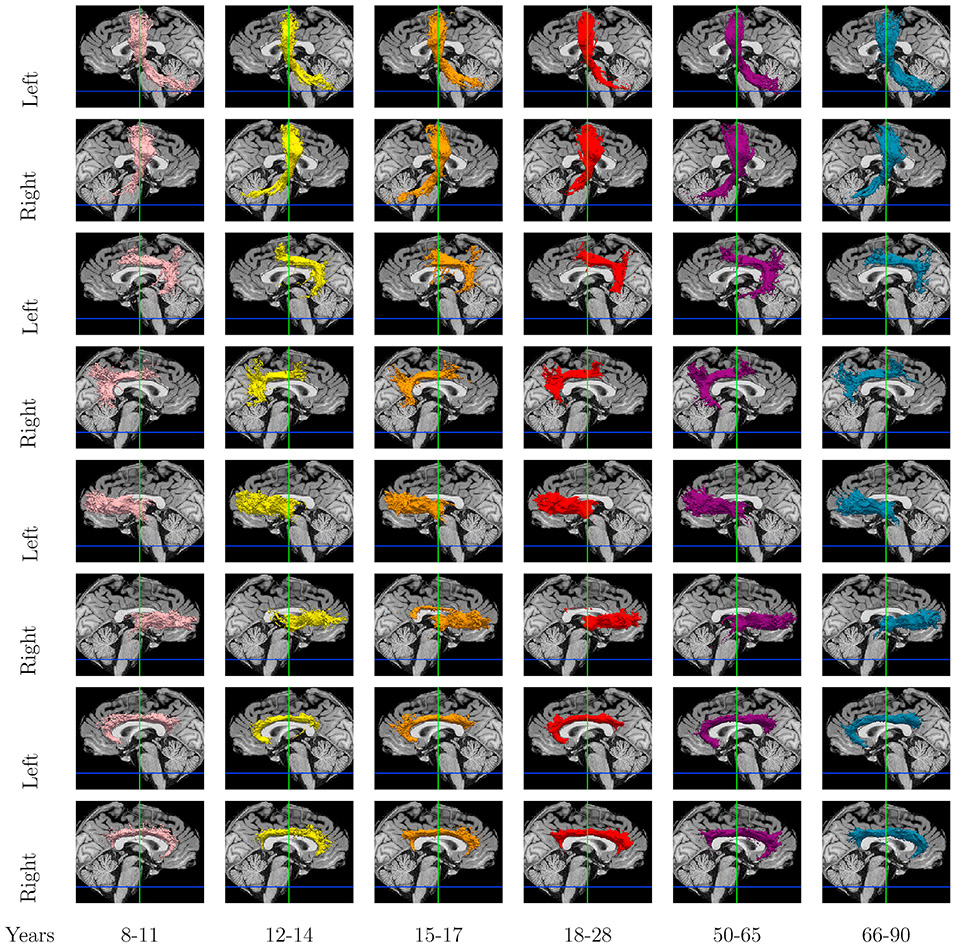
Diffusion MRI tractography produces massive sets of streamlines that need to be clustered into anatomically meaningful white-matter bundles. Conventional clustering techniques group streamlines based on their proximity in Euclidean space. We have developed AnatomiCuts, an unsupervised method for clustering tractography streamlines based on their neighboring anatomical structures, rather than their coordinates in Euclidean space. In this work, we show that the anatomical similarity metric used in AnatomiCuts can be extended to find corresponding clusters across subjects and across hemispheres, without inter-subject or inter-hemispheric registration. Our proposed approach enables group-wise tract cluster analysis, as well as studies of hemispheric asymmetry. We evaluate our approach on data from the pilot MGH-Harvard-USC Lifespan Human Connectome project, showing improved correspondence in tract clusters across 184 subjects aged 8-90. Our method shows up to 38% improvement in the overlap of corresponding clusters when comparing subjects with large age differences. The techniques presented here do not require registration to a template and can thus be applied to populations with large inter-subject variability, e.g., due to brain development, aging, or neurological disorders.

Keywords: Diffusion MRI; Hierarchical clustering; Normalized cuts; Tractography.


Figures

Fig. 1.
Fig. 1.
Algorithm overview: Whole-brain tractography streamlines from each individual (a) are grouped into a fixed number of clusters (b) with our anatomical similarity metric, which utilizes a cortical and subcortical segmentation from Freesurfer. Clusters from different subjects are matched based on their anatomical similarity (c), which does not require inter-subject registration. Clusters are also matched between each subject’s hemispheres based on their anatomical similarity, for symmetry analysis (d).
Fig. 2.
Fig. 2.
Age distribution of the 184 volunteers.
Fig. 3.
Fig. 3.
Inter-subject overlap. For each pair of subjects we average the Dice coefficients of the 200 corresponding clusters. We plot the average Dice coefficient of corresponding clusters for each pair of subjects, for clusters obtained with the anatomical and the Euclidean-distance similarity metric (a) and the percent difference between them (b), as a function of the age difference between subjects.
Fig. 4.
Fig. 4.
Coefficient of variation of the overlap of corresponding clusters across subjects for each similarity metric. Average values and standard error bars are plotted across different subjects chosen as the target for the Hungarian algorithm.
Fig. 5.
Fig. 5.
Histograms of the CV of anatomical (top row) and Euclidean distance (bottom row) inter-subject similarities. This is shown for different numbers of clusters per subject.
Fig. 6.
Fig. 6.
Examples of clusters with low (top 2 rows) and high (bottom 2 rows) CV of inter-subject similarity. Images show heat maps of binary cluster images, summed across subjects from each age group in template space.
Fig. 7.
Fig. 7.
Mean anatomical similarity of corresponding clusters between subjects and between hemispheres. This is shown for the hierarchical tree pruned at 50, 100, 150 and 200 clusters. Similarity values are normalized by the maximum value over all for display.
Fig. 8.
Fig. 8.
Inter-hemispheric cluster correspondence shown in alternate rows. We show isosurfaces color-coded by age group: pink (8–11), yellow (12–14), orange (15–17), red (18–28), purple (50–65), and blue (66–90).
Fig. 9.
Fig. 9.
Residual errors of Poisson, quadratic, and linear fits of the average FA, MD, AD, and RD vs. age, averaged over 200 clusters obtained with the anatomical (blue) and Euclidean-distance (orange) similarity metric. The bars represent standard deviation.
Fig. 10.
Fig. 10.
Poisson curves fit to average FA/MD/AD/RD of clusters obtained with the anatomical (blue) and the Euclidean-distance (orange) similarity metric. Results are shown for the three clusters of the left, where isosurfaces are color-coded by age group: pink (8–11), yellow (12–14), orange (15–17), red (18–28), purple (50–65), and blue (66–90). The clusters represent portions of the forceps major of the corpus callosum (top), left arcuate fasciculus (middle), and left cingulum bundle (bottom).
Fig. 11.
Fig. 11.
Poisson curves fit to average FA/MD/AD/RD of clusters obtained with the anatomical (blue) and the Euclidean-distance (orange) similarity metric. Results are shown for the three clusters on the left, where isosurfaces are color-coded by age group: pink (8–11), yellow (12–14), orange (15–17), red (18–28), purple (50–65), and blue (66–90). The clusters represent portions of the corpus callosum (top), right frontal aslant tract (middle), left frontal aslant tract (bottom).

References

    1. Andersson JLR, Sotiropoulos SN, January2016. An integrated approach to correction for off-resonance effects and subject movement in diffusion mr imaging. Neuroimage 125, 1063–1078. 10.1016/j.neuroimage.2015.10.019. - DOI - PMC - PubMed
    1. Andersson JLR, Skare S, Ashburner J, 2003. How to correct susceptibility distortions in spin-echo echo-planar images: application to diffusion tensor imaging. Neuroimage 20 (2), 870–888. 10.1016/S1053-8119(03)00336-7. ISSN 10538119. - DOI - PubMed
    1. Basser PJ, Mattiello J, LeBihan D, January1994. MR diffusion tensor spectroscopy and imaging. Biophys. J 66 (1), 259–267. 10.1016/s0006-3495(94)80775-1. - DOI - PMC - PubMed
    1. Baum GL, Ciric R, Roalf DR, Betzel RF, Moore TM, Shinohara RT, Kahn AE, Vandekar SN, Rupert PE, Quarmley M, Cook PA, Elliott MA, Ruparel K, Gur RE, Gur RC, Bassett DS, Satterthwaite TD, June2017. Modular segregation of structural brain networks supports the development of executive function in youth. Curr. Biol 27 (11), 1561–1572. 10.1016/j.cub.2017.04.051e8. - DOI - PMC - PubMed
    1. Baum GL, Roalf DR, Cook PA, Ciric R, Rosen AFG, Xia C, Elliott MA, Ruparel K, Verma R, Tunç B, Gur RC, Gur RE, Bassett DS, Satterthwaite TD, 2018. The impact of in-scanner head motion on structural connectivity derived from diffusion MRI. Neuroimage 173, 275–286. 10.1016/j.neuroimage.2018.02.041. ISSN 10959572. - DOI - PMC - PubMed

Publication types