

Sirt4 Modulates Oxidative Metabolism and Sensitivity to Rapamycin Through Species-Dependent Phenotypes in Drosophila mtDNA Haplotypes
- PMID: 32152006
- PMCID: PMC7202034
- DOI: 10.1534/g3.120.401174
Sirt4 Modulates Oxidative Metabolism and Sensitivity to Rapamycin Through Species-Dependent Phenotypes in Drosophila mtDNA Haplotypes
Abstract
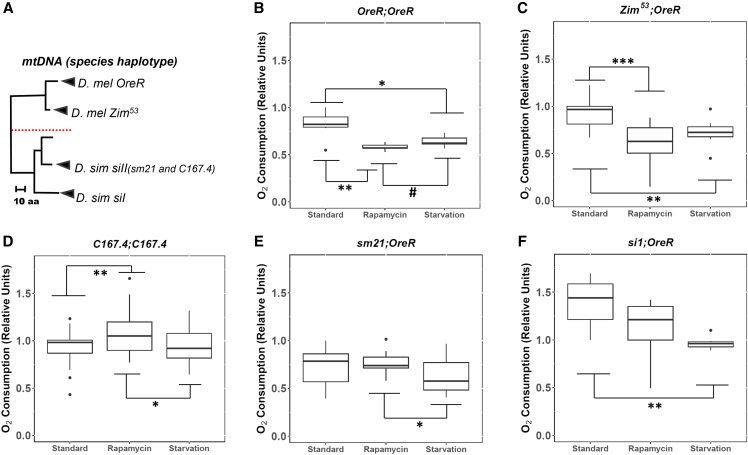
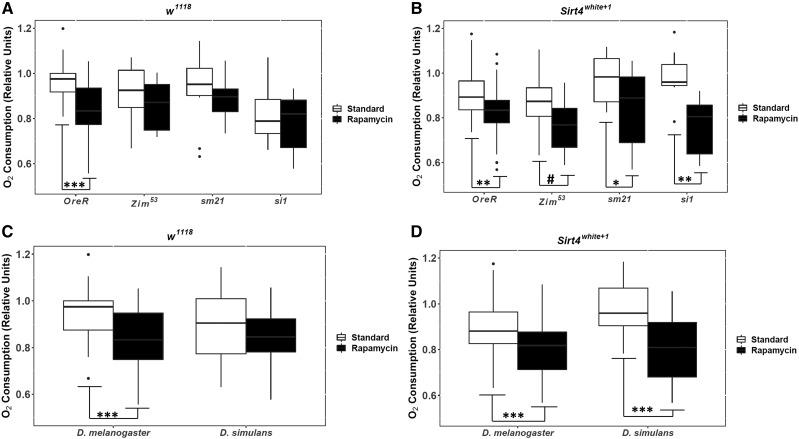
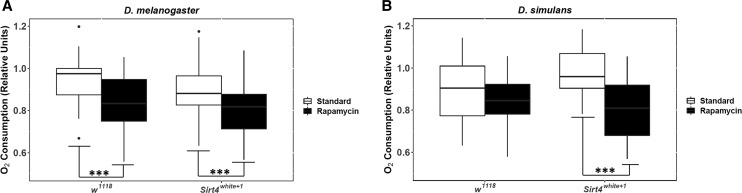
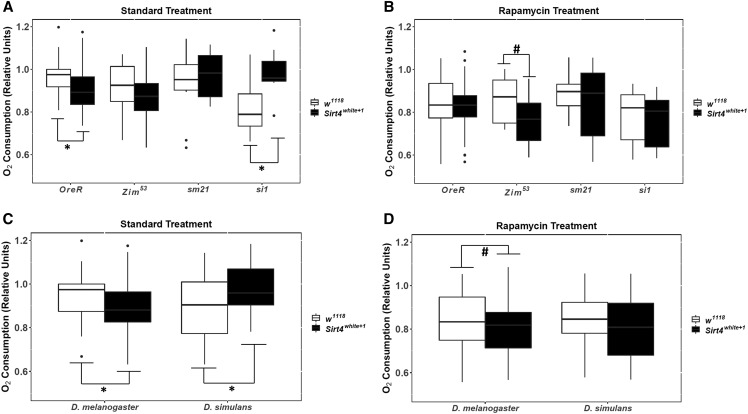
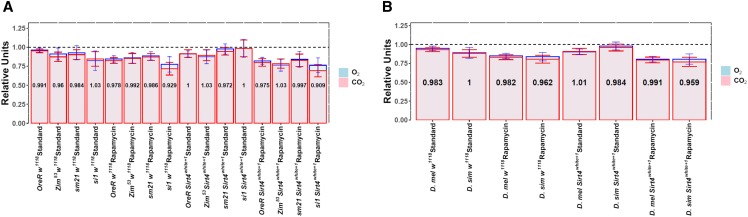
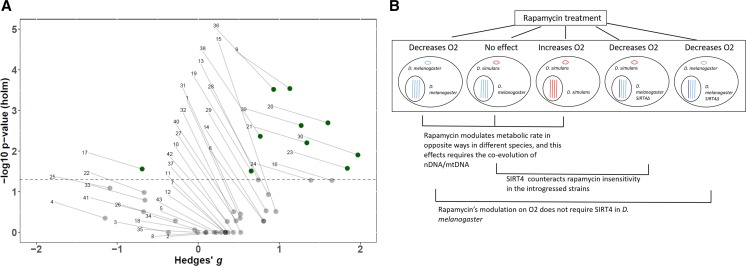
The endosymbiotic theory proposes that eukaryotes evolved from the symbiotic relationship between anaerobic (host) and aerobic prokaryotes. Through iterative genetic transfers, the mitochondrial and nuclear genomes coevolved, establishing the mitochondria as the hub of oxidative metabolism. To study this coevolution, we disrupt mitochondrial-nuclear epistatic interactions by using strains that have mitochondrial DNA (mtDNA) and nuclear DNA (nDNA) from evolutionarily divergent species. We undertake a multifaceted approach generating introgressed Drosophila strains containing D. simulans mtDNA and D. melanogaster nDNA with Sirtuin 4 (Sirt4)-knockouts. Sirt4 is a nuclear-encoded enzyme that functions, exclusively within the mitochondria, as a master regulator of oxidative metabolism. We exposed flies to the drug rapamycin in order to eliminate TOR signaling, thereby compromising the cytoplasmic crosstalk between the mitochondria and nucleus. Our results indicate that D. simulans and D. melanogaster mtDNA haplotypes display opposite Sirt4-mediated phenotypes in the regulation of whole-fly oxygen consumption. Moreover, our data reflect that the deletion of Sirt4 rescued the metabolic response to rapamycin among the introgressed strains. We propose that Sirt4 is a suitable candidate for studying the properties of mitochondrial-nuclear epistasis in modulating mitochondrial metabolism.
Keywords: Sirt4; TOR pathway; coevolution mtDNA/nDNA.
Copyright © 2020 Sejour et al.
Figures
Similar articles
-
Nuclear-mitochondrial epistasis and drosophila aging: introgression of Drosophila simulans mtDNA modifies longevity in D. melanogaster nuclear backgrounds.Genetics. 2006 Jan;172(1):329-41. doi: 10.1534/genetics.105.046698. Epub 2005 Oct 11. Genetics. 2006. PMID: 16219776 Free PMC article.
-
Rapamycin increases mitochondrial efficiency by mtDNA-dependent reprogramming of mitochondrial metabolism in Drosophila.J Cell Sci. 2014 May 15;127(Pt 10):2282-90. doi: 10.1242/jcs.142026. Epub 2014 Mar 7. J Cell Sci. 2014. PMID: 24610944 Free PMC article.
-
Sirt4 is a mitochondrial regulator of metabolism and lifespan in Drosophila melanogaster.Proc Natl Acad Sci U S A. 2018 Feb 13;115(7):1564-1569. doi: 10.1073/pnas.1720673115. Epub 2018 Jan 29. Proc Natl Acad Sci U S A. 2018. PMID: 29378963 Free PMC article.
-
Mitochondrial DNA in the Drosophila melanogaster complex.Genetica. 2004 Mar;120(1-3):41-50. doi: 10.1023/b:gene.0000017628.52056.97. Genetica. 2004. PMID: 15088645 Review.
-
Not all mitochondrial DNAs are made equal and the nucleus knows it.IUBMB Life. 2021 Mar;73(3):511-529. doi: 10.1002/iub.2434. Epub 2020 Dec 25. IUBMB Life. 2021. PMID: 33369015 Free PMC article. Review.
Cited by
-
Sex, tissue, and mitochondrial interactions modify the transcriptional response to rapamycin in Drosophila.BMC Genomics. 2024 Aug 7;25(1):766. doi: 10.1186/s12864-024-10647-x. BMC Genomics. 2024. PMID: 39107687 Free PMC article.
-
Why Is Longevity Still a Scientific Mystery? Sirtuins-Past, Present and Future.Int J Mol Sci. 2022 Dec 31;24(1):728. doi: 10.3390/ijms24010728. Int J Mol Sci. 2022. PMID: 36614171 Free PMC article. Review.
-
Targeting SIRT2 in Aging-Associated Fibrosis Pathophysiology.Aging Dis. 2024 Jul 5;16(4):2036-2053. doi: 10.14336/AD.202.0513. Aging Dis. 2024. PMID: 39226168 Free PMC article. Review.
-
Drosophila Sirtuin 6 mediates developmental diet-dependent programming of adult physiology and survival.Aging Cell. 2022 Mar;21(3):e13576. doi: 10.1111/acel.13576. Epub 2022 Mar 2. Aging Cell. 2022. PMID: 35233942 Free PMC article.
-
Mitochondrial sirtuin 4 shapes the intestinal microbiota of Drosophila by controlling lysozyme expression.Anim Microbiome. 2025 Jun 13;7(1):63. doi: 10.1186/s42523-025-00431-x. Anim Microbiome. 2025. PMID: 40514757 Free PMC article.
References
-
- Cardamone M. D., Tanasa B., Cederquist C. T., Huang J., Mahdaviani K. et al. , 2018. Mitochondrial Retrograde Signaling in Mammals Is Mediated by the Transcriptional Cofactor GPS2 via Direct Mitochondria-to-Nucleus Translocation. Mol. Cell 69: 757–772.e7. 10.1016/j.molcel.2018.01.037 - DOI - PMC - PubMed
-
- Charif D., and Lobry J. R., 2007. SeqinR 1.0–2: A Contributed Package to the R Project for Statistical Computing Devoted to Biological Sequences Retrieval and Analysis, pp. 207–232 Springer, Berlin, Heidelberg.
-
- Cohen J., 1988. Statistical Power Analysis for the Behavioral Sciences, Ed. 2nd Lawrence Erlbaum Associates, New Jersey.
Publication types
MeSH terms
Substances
Grants and funding
LinkOut - more resources
Full Text Sources
Molecular Biology Databases