. 2020 May;215(1):173-192.
doi: 10.1534/genetics.119.303002. Epub 2020 Mar 9.

Toward an Evolutionarily Appropriate Null Model: Jointly Inferring Demography and Purifying Selection

Affiliations

Toward an Evolutionarily Appropriate Null Model: Jointly Inferring Demography and Purifying Selection

Parul Johri et al. Genetics. 2020 May.

Abstract

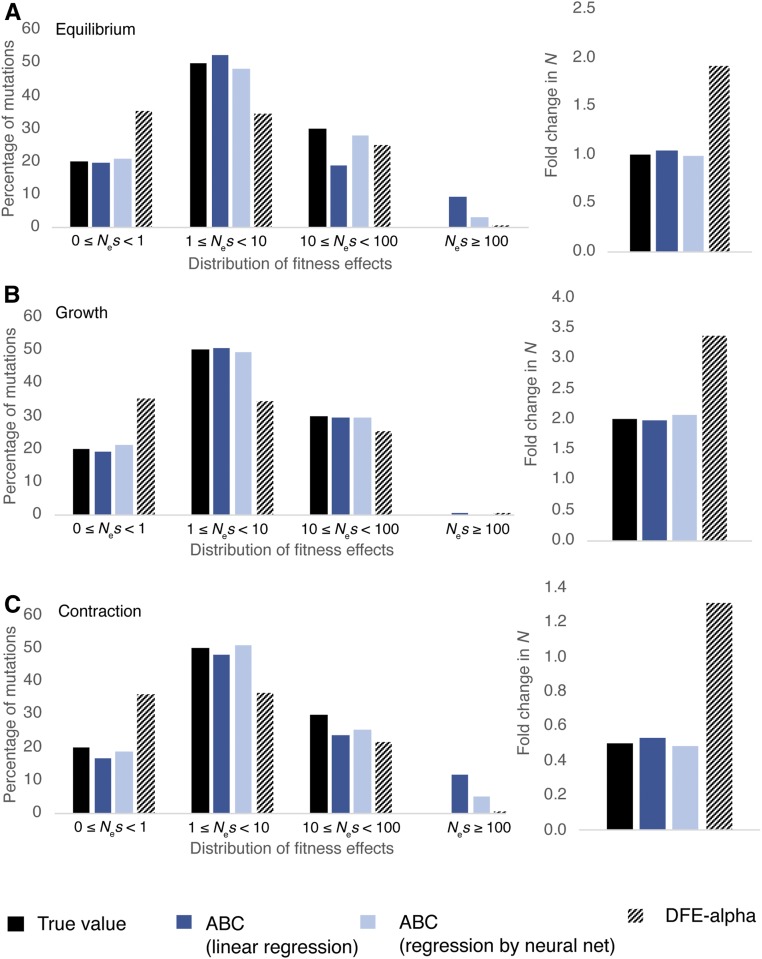
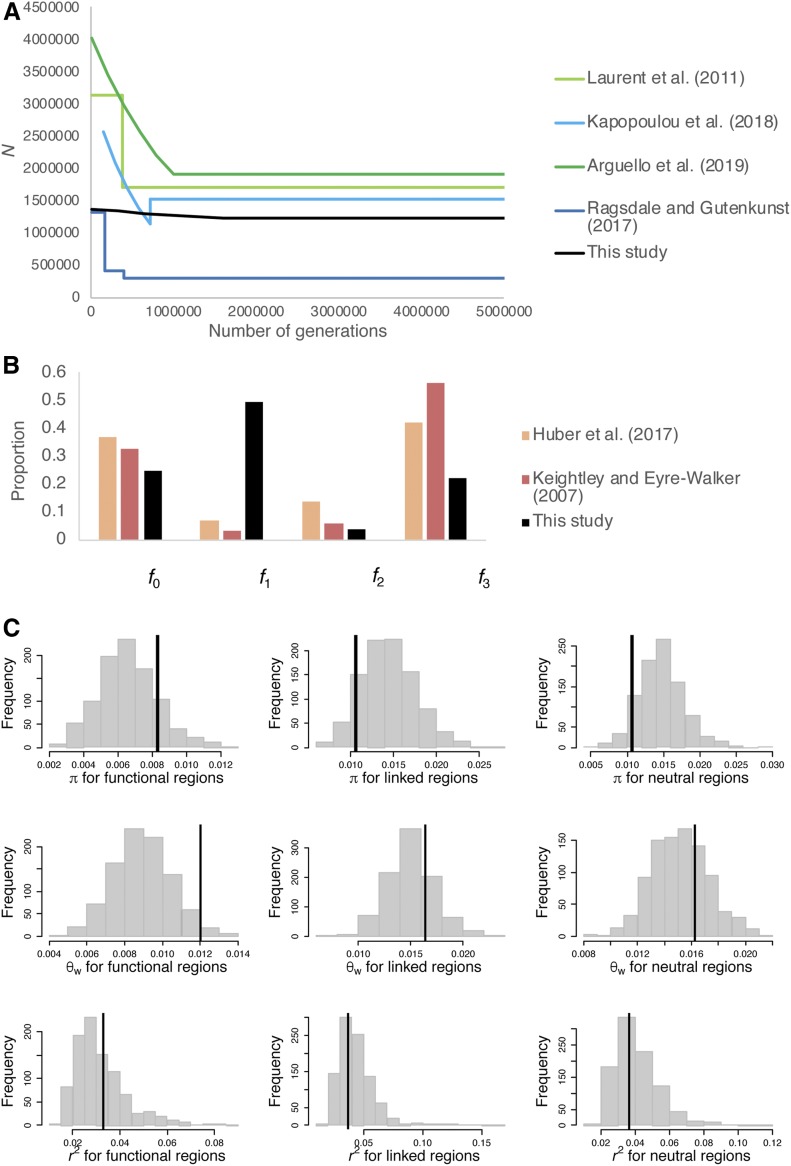
The question of the relative evolutionary roles of adaptive and nonadaptive processes has been a central debate in population genetics for nearly a century. While advances have been made in the theoretical development of the underlying models, and statistical methods for estimating their parameters from large-scale genomic data, a framework for an appropriate null model remains elusive. A model incorporating evolutionary processes known to be in constant operation, genetic drift (as modulated by the demographic history of the population) and purifying selection, is lacking. Without such a null model, the role of adaptive processes in shaping within- and between-population variation may not be accurately assessed. Here, we investigate how population size changes and the strength of purifying selection affect patterns of variation at "neutral" sites near functional genomic components. We propose a novel statistical framework for jointly inferring the contribution of the relevant selective and demographic parameters. By means of extensive performance analyses, we quantify the utility of the approach, identify the most important statistics for parameter estimation, and compare the results with existing methods. Finally, we reanalyze genome-wide population-level data from a Zambian population of Drosophila melanogaster, and find that it has experienced a much slower rate of population growth than was inferred when the effects of purifying selection were neglected. Our approach represents an appropriate null model, against which the effects of positive selection can be assessed.

Keywords: approximate Bayesian computation; background selection; demographic inference; distribution of fitness effects.


Figures

Figure 1
Figure 1
(A) An example of a discrete DFE with four classes of mutations. The proportion of each class of mutation, fi, lies between 0 and 1. (B) Nucleotide-site diversity relative to the neutral expectation (B = π/π0) as a function of the distance from the directly selected sites (length 1 kb), as predicted by the analytical solution (black points) and as observed in simulations (red points). (C and D) Analytical predictions and simulated values for a DFE with larger contributions from the weakly deleterious class of mutations. Note that, for the analytical solutions, the two classes of results represent cases where mutations with 2Net < 5 (black circles) and 2Net < 2.5 (blue triangles) were ignored. DFE, distribution of fitness effects.
Figure 2
Figure 2
Effects of BGS under demographic equilibrium. (A) The slope of the recovery of nucleotide diversity in 10-kb linked neutral regions flanking functional regions, such that π = slope*ln (distance from functional region) + intercept, (B) nucleotide diversity in 500-bp linked neutral regions flanking functional regions relative to neutral expectation (B), and (C) Tajima’s D for 500-bp linked neutral region flanking functional regions. All of the above are shown for various sizes of functional elements (0.5–10 kb) and DFE shapes. The four DFE shapes considered are fi ≥ 0.8 for i = 0,1,2,3, with > 80% of mutations residing in DFE class fi, such that ∑fj ≤ 0.2, where ji. The DFE category “all” represents an average over all possible DFE shapes. The error bars are 2 × SD. Red points show the analytical predictions for B with: (1) f0 = 0.85, f1 = 0.05, f2 = 0.05, and f3 = 0.05; (2) f0 = 0.05, f1 = 0.85, f2 = 0.05, and f3 = 0.05; (3) f0 = 0.05, f1 = 0.05, f2 = 0.85, and f3 = 0.05; and (4) f0 = 0.05, f1 = 0.05, f2 = 0.05, and f3 = 0.85. BGS, background selection; DFE, distribution of fitness effects.
Figure 3
Figure 3
Effects of BGS under nonequilibrium demography. (A) The slope of recovery of nucleotide diversity in linked neutral regions for different DFE shapes under equilibrium demography (black), population expansion (blue), and contraction (red). (B) Nucleotide-site diversity relative to neutral expectation (B), over 500 bp of linked neutral regions flanking functional regions, for varying DFE shapes and three different demographic models: equilibrium (black), 10-fold exponential expansion (blue), and 10-fold exponential decline (red). (C) Tajima’s D for the 500-bp linked neutral region flanking the functional region under equilibrium, (D) after a 10-fold expansion, and (E) after a 10-fold population size reduction. The four DFE shapes considered in all panels are fi ≥ 80% for i = 0–3, where > 80% of mutations reside in DFE class fi. The DFE category “all” represents an average over all possible DFE shapes. For nonequilibrium demography, γ = 2Nancs, where Nanc is the ancestral population size. BGS, background selection; DFE, distribution of fitness effects.
Figure 4
Figure 4
(A) Values of diversity statistics across functional, linked, and neutral regions. (B) Accuracy of estimation (cross-validation) of the four classes of the DFE using statistics for functional regions only (size 1 kb), under equilibrium demography. (C) Joint estimation of population size changes and the DFE using all statistics. (D) Joint estimation of population size changes and the DFE using statistics for functional regions only. The true proportions of mutations in each DFE class and Nanc and Ncur are given on the x-axes, while the estimated values are given on the y-axes. Parameters are indicated in the upper left corners for each plot. Each dot represents 1 out of 200 different parameter combinations, sampled randomly from the entire set of simulations. DFE, distribution of fitness effects.
Figure 5
Figure 5
Comparison of the performance of the proposed ABC approach in the current study with DFE-α (when there is selection on synonymous sites), under (A) demographic equilibrium, (B) exponential growth, and (C) exponential decline. In all cases, 30% of sites were assumed to be synonymous, out of which 33% were weakly selected. Solid black bars are the true simulated values, dark blue bars give the ABC performance using ridge regression, and light blue bars give the ABC performance using linear regression aided by neural nets. Patterned bars show the performance of DFE-α. A total of 998,300 sites were analyzed in the functional region for each parameter combination, with ∼332,767 representing synonymous and 665,533 representing nonsynonymous sites. ABC, approximate Bayesian computation; DFE, distribution of fitness effects.
Figure 6
Figure 6
Joint inference of demography and purifying selection in the Zambian population of D. melanogaster. (A) Demographic model inferred in previous studies of the Zambian population (blue lines), the Zimbabwe population (green lines), and the current study (black lines). (B) The DFE for deleterious mutations in coding regions (including synonymous and nonsynonymous sites) as inferred by previous studies of other populations (colored bars) and at exonic sites of single-exon genes as inferred in the current study (black bars). The x-axis is for f0: 0 ≤ 2Nes < 1, f1: 1 ≤ 2Nes < 10, f2: 10 ≤ 2Nes < 100, and f3: 100 ≤ 2Nes < 10,000. For the previous studies, the DFE shown in this figure includes the fraction of synonymous sites in the neutral f0 class. (C) Distribution of key summary statistics (π, θW, and r2) for functional, linked, and neutral regions when simulating 100 replicates of 94 exons each using the inferred parameters. The vertical lines represent values of the statistics obtained from 76 individuals of D. melanogaster from Zambia, after excluding noncoding sites with phastCons score ≥ 0.8. DFE, distribution of fitness effects.

References

    1. Akashi H., 1995. Inferring weak selection from patterns of polymorphism and divergence at “silent” sites in Drosophila DNA. Genetics 139: 1067–1076. - PMC - PubMed
    1. Andolfatto P., 2005. Adaptive evolution of non-coding DNA in Drosophila. Nature 437: 1149–1152. 10.1038/nature04107 - DOI - PubMed
    1. Arguello J. R., Laurent S., and Clark A. G., 2019. Demographic history of the human commensal Drosophila melanogaster. Genome Biol. Evol. 11: 844–854. 10.1093/gbe/evz022 - DOI - PMC - PubMed
    1. Assaf Z. J., Tilk S., Park J., Siegal M. L., and Petrov D. A., 2017. Deep sequencing of natural and experimental populations of Drosophila melanogaster reveals biases in the spectrum of new mutations. Genome Res. 27: 1988–2000. 10.1101/gr.219956.116 - DOI - PMC - PubMed
    1. Bank C., Hietpas R. T., Wong A., Bolon D. N., and Jensen J. D., 2014a A Bayesian MCMC approach to assess the complete distribution of fitness effects of new mutations: uncovering the potential for adaptive walks in challenging environments. Genetics 196: 841–852. 10.1534/genetics.113.156190 - DOI - PMC - PubMed

Publication types

LinkOut - more resources