. 2020 May;215(1):143-171.
doi: 10.1534/genetics.120.303137. Epub 2020 Mar 9.

Identifying and Classifying Shared Selective Sweeps from Multilocus Data

Affiliations

Identifying and Classifying Shared Selective Sweeps from Multilocus Data

Alexandre M Harris et al. Genetics. 2020 May.

Abstract

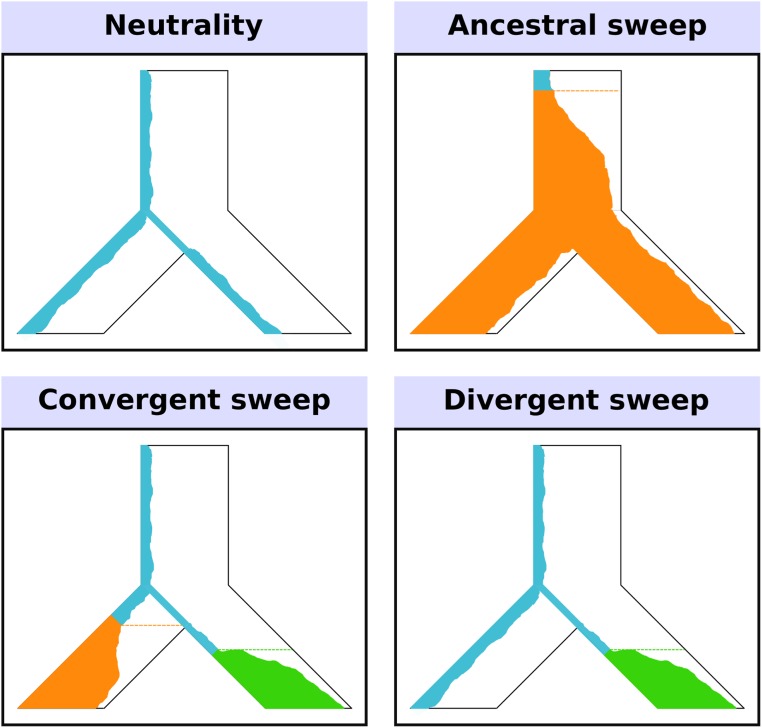
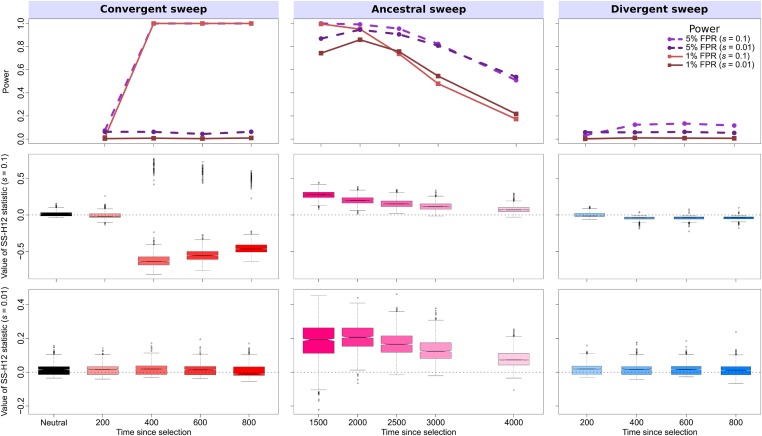
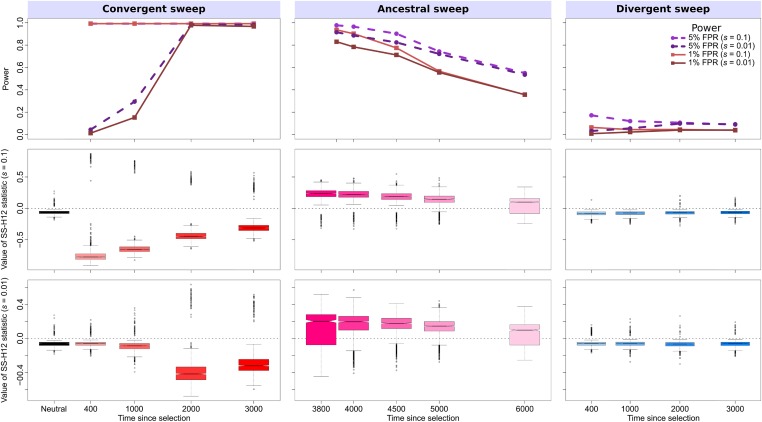
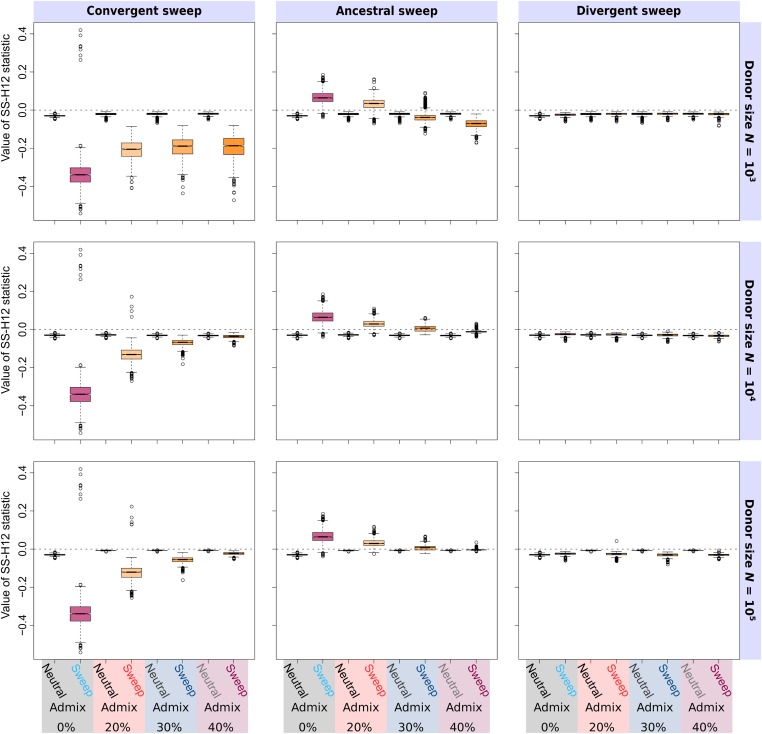
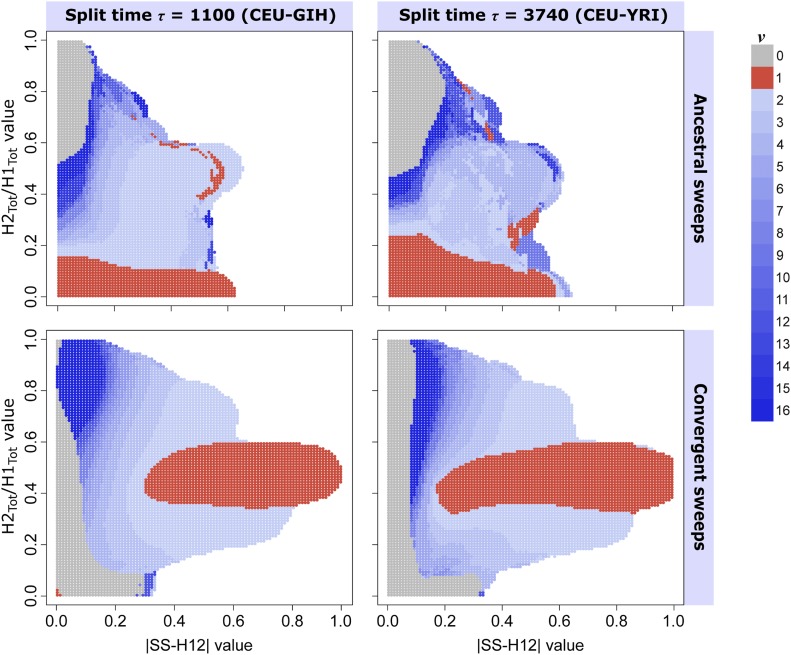
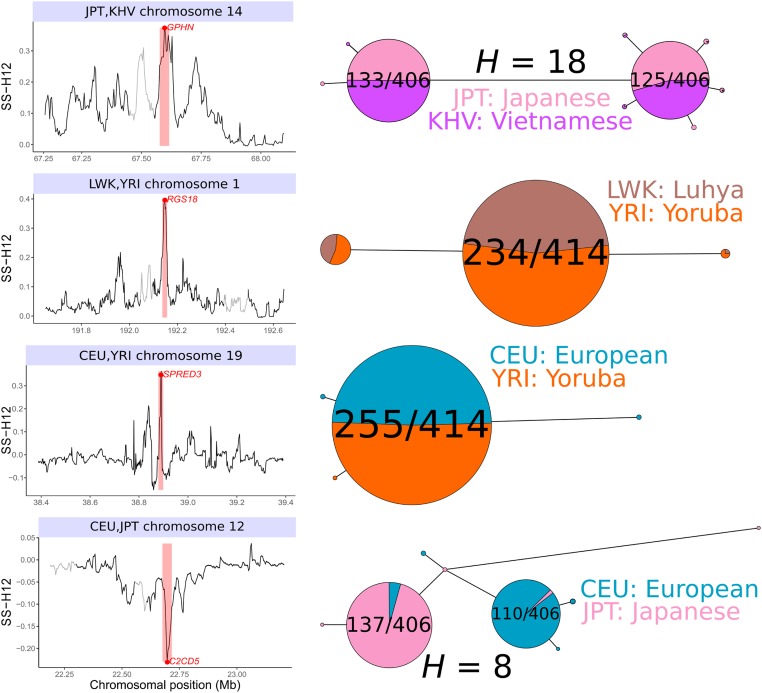
Positive selection causes beneficial alleles to rise to high frequency, resulting in a selective sweep of the diversity surrounding the selected sites. Accordingly, the signature of a selective sweep in an ancestral population may still remain in its descendants. Identifying signatures of selection in the ancestor that are shared among its descendants is important to contextualize the timing of a sweep, but few methods exist for this purpose. We introduce the statistic SS-H12, which can identify genomic regions under shared positive selection across populations and is based on the theory of the expected haplotype homozygosity statistic H12, which detects recent hard and soft sweeps from the presence of high-frequency haplotypes. SS-H12 is distinct from comparable statistics because it requires a minimum of only two populations, and properly identifies and differentiates between independent convergent sweeps and true ancestral sweeps, with high power and robustness to a variety of demographic models. Furthermore, we can apply SS-H12 in conjunction with the ratio of statistics we term [Formula: see text] and [Formula: see text] to further classify identified shared sweeps as hard or soft. Finally, we identified both previously reported and novel shared sweep candidates from human whole-genome sequences. Previously reported candidates include the well-characterized ancestral sweeps at LCT and SLC24A5 in Indo-Europeans, as well as GPHN worldwide. Novel candidates include an ancestral sweep at RGS18 in sub-Saharan Africans involved in regulating the platelet response and implicated in sudden cardiac death, and a convergent sweep at C2CD5 between European and East Asian populations that may explain their different insulin responses.

Keywords: ancestral sweep; convergent sweep; expected haplotype homozygosity; multilocus genotype.


Figures

Figure 1
Figure 1
Model of a two-population phylogeny for which SS-H12 detects recent shared sweeps. Here, an ancestral population splits in the past into two modern lineages, which are sampled. Each panel displays the frequency trajectory of a haplotype across the populations. Under neutrality, there is high haplotypic diversity such that many haplotypes, including the reference haplotype (blue), exist at low frequency. In the ancestral sweep, the reference haplotype becomes selectively advantageous (turning orange) and rises to high frequency prior to the split, such that both modern lineages carry the same selected haplotype at high frequency. The convergent sweep scenario involves different selected haplotypes independently rising to high frequency in each lineage after their split. Under a divergent sweep, only one sampled lineage experiences selection.
Figure 2
Figure 2
Properties of SS-H12 for simulated strong (s=0.1; σ=4Nes=4000) and moderate (s=0.01; σ=400) hard sweep scenarios under the CEU-GIH model (τ=1100 generations, or 0.055 coalescent units, before sampling). (Top row) Power at 1% (red lines) and 5% (purple lines) false positive rates (FPRs) to detect recent ancestral, convergent, and divergent hard sweeps (see Figure 1) as a function of time at which positive selection of the favored allele initiated (t), with FPR based on the distribution of maximum |SSH12| across simulated neutral replicates. (Middle row) Box plots summarizing the distribution of SS-H12 values from windows of maximum |SSH12| across strong sweep replicates, corresponding to each time point in the power curves, with dashed lines in each panel representing SSH12=0. (Bottom row) Box plots summarizing the distribution of SS-H12 values across moderate sweep replicates. For convergent and divergent sweeps, t<τ, while for ancestral sweeps, t>τ. All replicate samples for the CEU-GIH model contain 99 simulated CEU individuals and 103 simulated GIH individuals, as in the 1000 Genomes Project dataset (1000 Genomes Project Consortium et al. 2015), and we performed 1000 replicates for each scenario. CEU: Utah Residents with Northern and Western European Ancestry. GIH: Gujarati Indians from Houston, Texas.
Figure 3
Figure 3
Properties of SS-H12 for simulated strong (s=0.1; σ=4Nes=8000) and moderate (s=0.01; σ=800) hard sweep scenarios under the CEU-YRI model (τ=3740 generations, or 0.0935 coalescent units, before sampling). (Top row) Power at 1% (red lines) and 5% (purple lines) false positive rates (FPRs) to detect recent ancestral, convergent, and divergent hard sweeps (see Figure 1) as a function of time at which positive selection of the favored allele initiated (t), with FPR based on the distribution of maximum |SSH12| across simulated neutral replicates. (Middle row) Box plots summarizing the distribution of SS-H12 values from windows of maximum |SSH12| across strong sweep replicates, corresponding to each time point in the power curves, with dashed lines in each panel representing SSH12=0. (Bottom row) Box plots summarizing the distribution of SS-H12 values across moderate sweep replicates. For convergent and divergent sweeps, t<τ, while for ancestral sweeps, t>τ. All replicate samples for the CEU-YRI model contain 99 simulated CEU individuals and 108 simulated YRI individuals, as in the 1000 Genomes Project dataset (1000 Genomes Project Consortium et al. 2015), and we performed 1000 replicates for each scenario. YRI: Yoruba people from Ibadan, Nigeria.
Figure 4
Figure 4
Effect of admixture from a diverged, unsampled donor lineage on distributions of SS-H12 values at peaks of maximum |SSH12|, in samples consisting of individuals from K=2 populations following the simplified mammalian model (τ=1000; 0.05 coalescent units), under simulated recent ancestral, convergent, and divergent sweeps. For ancestral sweeps, selection occurred 1400 generations (0.07 coalescent units) before sampling. For convergent and divergent sweeps, selection occurred 600 generations (0.03 coalescent units) before sampling. The effective size of the donor population varies from N=103 (an order of magnitude less than that of the sampled populations), to N=105 (an order of magnitude more), with admixture at 200 generations (0.01 coalescent units) before sampling at rates 0.2 to 0.4, modeled as a single pulse. The donor diverged from the sampled populations 2×104=2N generations (one coalescent unit) before sampling. In divergent sweep scenarios, admixture occurred specifically into the population experiencing a sweep. All sample sizes are of n=100 diploid individuals, with 1000 replicates performed for each scenario. For comparison, we include unadmixed results in each panel.
Figure 5
Figure 5
Ability of paired (|SSH12|,, H2Tot/H1Tot) values to infer the most probable number of sweeping haplotypes ν in a shared sweep. Most probable ν for each test point was assigned from the posterior distribution of 5×10⁶ sweep replicates with ν{0,1,,16}, drawn uniformly at random. (Top row) Ancestral sweeps for the CEU-GIH model (τ=1100, τ/(2Ne)=0.055 coalescent units, left) and the CEU-YRI model (τ=3740, τ/(2Ne)=0.0935 coalescent units, right), with t[1140,3000] (t/(2Ne)[0.057,0.15] coalescent units, left) and t[3780,5000] (t/(2Ne)[0.0945,0.125] coalescent units, right). (Bottom row) Convergent sweeps for the CEU-GIH model (left) and the CEU-YRI model (right), with t[200,1060] (t/(2Ne)[0.01,0.053] coalescent units, left) and t[200,3700] (t/(2Ne)[0.005,0.0925] coalescent units, right). Colored in red are points whose paired (|SSH12|, H2Tot/H1Tot) values are more likely to result from hard sweeps, those colored in shades of blue are points more likely to be generated from soft sweeps, and gray indicates a greater probability of neutrality. Regions in white are those for which no observations of sweep replicates within a Euclidean distance of 0.1 exist.
Figure 6
Figure 6
Top outlying shared sweep candidates at RNA- and protein-coding genes in global human populations. The signal peak, including chromosomal position, magnitude, and highlighted window of maximum SS-H12 (left column), as well as the pegas haplotype network for the window (Paradis 2010) are displayed for each candidate. The East Asian JPT and KHV populations experience an ancestral soft sweep at GPHN (top row). The sub-Saharan African populations LWK and YRI share an ancestral hard sweep at RGS18 (second row). The European CEU population experiences a shared sweep with YRI at SPRED3 (third row). The European CEU and East Asian JPT have a convergent sweep at C2CD5, with a different, single high-frequency haplotype present in each population (bottom row). Haplotype networks are truncated to retain only haplotypes with an observed count 6. The number of haplotypes belonging to the sweeping class (es) is indicated as a fraction, and the Hamming distance (H) between sweeping haplotypes is indicated where applicable. New population abbreviations: Japanese people from Tokyo (JPT); Kinh people of Ho Chi Minh City, Vietnam (KHV); Luhya people from Webuye, Kenya (LWK).

Similar articles

Cited by

References

    1. 1000 Genomes Project Consortium; Abecasis G. R., Altshuler D., Auton A., Brooks L. D., Durbin R. M. et al. , 2011. A map of human genome variation from population-scale sequencing. Nature 467: 1061–1073. 10.1038/nature09534 - DOI - PMC - PubMed
    1. 1000 Genomes Project Consortium;Auton A., Brooks L. D., Durbin R. M., Garrison E. P., Kang H. M. et al. , 2015. A global reference for human genetic variation. Nature 526: 68–74. 10.1038/nature15393 - DOI - PMC - PubMed
    1. Akbari A., Vitti J. J., Iranmehr A., Bakhtiari M., Sabeti P. C. et al. , 2018. Identifying the favored mutation in a positive selective sweep. Nat. Methods 15: 279–282. 10.1038/nmeth.4606 - DOI - PMC - PubMed
    1. Altshuler D., Daly M. J., and Lander E. S., 2008. Genetic mapping in human disease. Science 322: 881–888. 10.1126/science.1156409 - DOI - PMC - PubMed
    1. Anczuków O., Akerman M., Cléry A., Wu J., Shen C. et al. , 2015. SRSF1-regulated alternative splicing in breast cancer. Mol. Cell 60: 105–117. 10.1016/j.molcel.2015.09.005 - DOI - PMC - PubMed

Publication types