. 2020 Apr 8;7(2):ENEURO.0026-20.2020.
doi: 10.1523/ENEURO.0026-20.2020. Print 2020 Mar/Apr.

Neural Isolation of the Olfactory Bulbs Severely Impairs Taste-Guided Behavior to Normally Preferred, But Not Avoided, Stimuli

Affiliations

Neural Isolation of the Olfactory Bulbs Severely Impairs Taste-Guided Behavior to Normally Preferred, But Not Avoided, Stimuli

Chizuko Inui-Yamamoto et al. eNeuro. .

Abstract

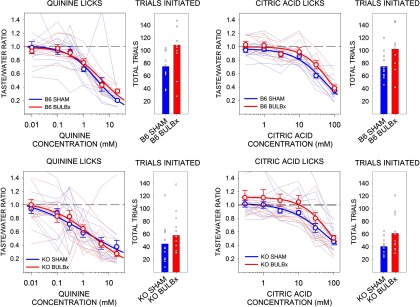
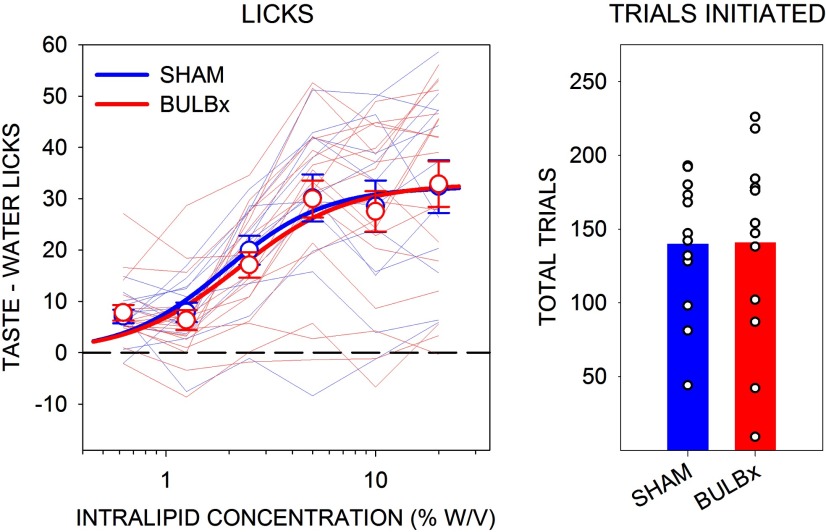
Here we systematically tested the hypothesis that motivated behavioral responsiveness to preferred and avoided taste compounds is relatively independent of the olfactory system in mice whose olfactory bulbs (main and accessory) were surgically disconnected from the rest of the brain [bulbotomy (BULBx)]. BULBx was confirmed histologically as well as functionally with the buried food test. In brief access taste tests, animals received 10-s trials of various concentrations of a taste compound delivered quasirandomly. BULBx C57BL/6 (B6) mice displayed severely blunted concentration-dependent licking for the disaccharide sucrose, the maltodextrin Maltrin, and the fat emulsion Intralipid relative to their sham-operated controls (SHAM B6). Licking for the noncaloric sweetener saccharin was also blunted by bulbotomy, but less so. As expected, mice lacking a functional "sweet" receptor [T1R2+T1R3 knockout (KO)] displayed concentration-dependent responsiveness to Maltrin and severely attenuated licking to sucrose. Like in B6 mice, responsiveness to both stimuli was exceptionally curtailed by bulbotomy. In contrast to these deficits in taste-guided behavior for unconditionally preferred stimuli, BULBx in B6 and KO mice did not alter concentration-dependent decreases for the representative avoided stimuli quinine and citric acid. Nor did it temper the intake of and preference for high concentrations of affectively positive stimuli when presented in long-term (23-h) two-bottle tests, demonstrating that the surgery does not lead to a generalized motivational deficit. Collectively, these behavioral results demonstrate that specific aspects of taste-guided ingestive motivation are profoundly disturbed by eliminating the anatomic connections between the main/accessory olfactory bulbs and the rest of the brain.

Keywords: affect; gustatory system; olfactory system; reward; smell; taste.


Figures

Figure 1.
Figure 1.
Postsurgical buried food test. Latencies to find the buried potato crisp for each experiment by group (SHAM: blue circles, BULBx: red circles; horizontal lines: median latencies). These tests were performed after the end of behavioral testing. BULBx animals with BFT latencies <450 s were discarded from the behavioral analyses. Mice failing to find the potato crisp during the test underwent a visual test. Median latency (±SIQR) in seconds for the visual test are as follows: experiment 1: B6 BULBx, 9.2 (±9.2); KO BULBx, 11.7 (±8.1); experiment 2: B6 BULBx, 20.4 (±8.7); KO BULBx, 14.5 (±25.8); experiment 3: B6 BULBx, 77.6 (±93.6); experiment 4: B6 BULBx, 81.2 (60.7); KO BULBx, 24.7 (20.4). These mice all passed the presurgical BFT with a latency <110 s.
Figure 2.
Figure 2.
Mean (±SE) presurgical lick scores (left) and the mean total number of taste trials initiated (right) in response to Maltrin by B6 (top) and KO (bottom) mice in experiment 1. SHAM groups are shown in blue, and BULBx groups are shown in red. Lighter blue and red lines represent lick scores of individual mice. Only sessions with at least one trial per concentration were included for lick analyses. B6 SHAM, n = 12; B6 BULBx, n = 11; KO SHAM, n = 11; KO BULBx, n = 12. Licks to each concentration are standardized to the mean (±SE) licks to water: B6 SHAM, 13.2 ± 1.0; B6 BULBx, 12.7 ± 1.2; KO SHAM, 22.1 ± 3.4; KO BULBx, 18.1 ± 1.8. See Tables 1 and 2 for outcomes of statistical tests.
Figure 3.
Figure 3.
Mean (±SE) postsurgical lick scores and the mean (±SE) total number of taste trials initiated to Maltrin and sucrose by B6 (top) and KO (bottom) mice in experiment 1. SHAM groups are shown in blue, and BULBx groups are shown in red. Lighter blue and red lines represent lick scores of individual mice. Only sessions with at least one trial per concentration were included for lick analyses. Group sizes for Maltrin were as follows: B6 SHAM, n = 12; B6 BULBx, n = 11; KO SHAM, n = 12; KO BULBx, n = 12. Group sizes for sucrose were as follows: B6 SHAM, n = 12; B6 BULBx, n = 10; KO SHAM, n = 12; KO BULBx, n = 12. Licks to each concentration are standardized to the mean (±SE) number of licks to water. Maltrin water licks were as follows: B6 SHAM, 12.1 ± 0.9; B6 BULBx, 11.5 ± 2.4; KO SHAM, 17.7 ± 1.9; KO BULBx, 15.9 ± 2.6. Sucrose water licks were as follows: B6 SHAM, 12.1 ± 1.1; B6 BULBx, 12.5 ± 2.4; KO SHAM, 24.3 ± 3.1; KO BULBx, 13.4 ± 2.4. See Tables 1 and 2 for outcomes of statistical tests.
Figure 4.
Figure 4.
Mean (±SE) postsurgical taste/water ratios and the mean (±SE) total number of taste trials initiated to quinine and citric acid by B6 (top) and KO (bottom) mice in experiment 2. SHAM groups are shown in blue, and BULBx groups are shown in red. Lighter blue and red lines represent taste/water ratios of individual mice. Only sessions with at least one trial per concentration were included for lick analyses. Group sizes for quinine were as follows: B6 SHAM, n = 12; B6 BULBx, n = 9; KO SHAM, n = 13; KO BULBx, n = 11. Group sizes for citric acid were as follows: B6 SHAM, n = 12; B6 BULBx, n = 8; KO SHAM, n = 13; KO BULBx, n = 12. Licks to each concentration are standardized to the mean (±SE) licks to water. Quinine water licks were as follows: B6 SHAM, 53.8 ± 6.8; B6 BULBx, 49.5 ± 2.1; KO SHAM, 63.22 ± 3.4; KO BULBx, 60.3 ± 4.3. Citric acid water licks were as follows: B6 SHAM, 59.8 ± 2.5; B6 BULBx, 50.7 ± 1.3; KO SHAM, 67.87 ± 2.8; KO BULBx, 57.9 ± 5.5. See Tables 2 and 3 for outcomes of statistical tests.
Figure 5.
Figure 5.
Mean (±SE) presurgical Lick Scores (left) and mean total number of taste trials initiated (right) to Intralipid by B6 mice in experiment 3. SHAM groups are shown in blue, and BULBx groups are shown in red. Lighter blue and red lines represent lick scores of individual mice. Only sessions with at least one trial per concentration were included for lick analyses. SHAM, n = 12; BULBx, n = 18. Licks to each concentration are standardized to the mean (±SE) licks to water: SHAM, 15.2 ± 0.8; BULBx, 14.5 ± 1.2. See Tables 2 and 4 for outcomes of statistical tests.
Figure 6.
Figure 6.
Mean (±SE) postsurgical lick scores (left) and the mean total number of taste trials initiated (right) to Intralipid (top), sucrose (middle), and saccharin (bottom) by B6 mice in experiment 3. SHAM groups are shown in blue, and BULBx groups are shown in red. Lighter blue and red lines represent lick scores of individual mice. Only sessions with at least one trial per concentration were included for lick analyses, as follows: Intralipid: SHAM, n = 12; BULBx, n = 11; sucrose: SHAM, n = 12; BULBx, n = 16; saccharin: SHAM, n = 12; BULBx, n = 17. Licks to each concentration are standardized to the mean (±SE) licks to water, as follows: Intralipid: SHAM, 12.3 ± 1.0; BULBx, 30.8 ± 4.7; sucrose: SHAM, 8.2 ± 0.9; BULBx, 11.7 ± 1.4; saccharin: SHAM, 8.7 ± 1.4; BULBx, 7.3 ± 0.8. See Tables 2 and 4 for outcomes of statistical tests.
Figure 7.
Figure 7.
Mean (±SE) preference ratios to sucrose (top) and Maltrin (bottom) by B6 (left, circles) and KO (right, triangles) mice in experiment 4. SHAM groups are shown in blue, and BULBx groups are shown in red. Lighter blue and red lines represent preference ratios of individual mice. Preference ratios are calculated by dividing intake of the solution by total intake (solution + water). B6 SHAM, n = 8; B6 BULBx, n = 13; KO SHAM, n = 8; KO BULBx, n = 7. See Tables 5 and 6 for outcomes of statistical tests.
Figure 8.
Figure 8.
Mean (±SE) intake of sucrose (top) and Maltrin (bottom) by B6 (left, circles) and KO (right, triangles) mice in experiment 4. SHAM groups are shown in blue, and BULBx groups are shown in red. Lighter blue and red lines represent intakes of individual mice. B6 SHAM, n = 8; B6 BULBx, n = 13; KO SHAM, n = 8; KO BULBx, n = 7. See Tables 5 and 6 for outcomes of statistical tests.
Figure 9.
Figure 9.
Mean (±SE) total caloric intake during two-bottle testing with water (left), Maltrin (middle), and sucrose (right) by B6 (left, circles) and KO (right, triangles) mice in experiment 4. SHAM groups are shown in blue, and BULBx groups are shown in red. Lighter blue and red lines represent total caloric intakes of individual mice. B6 SHAM, n = 8; B6 BULBx, n = 13; KO SHAM, n = 8; KO BULBx, n = 7. See Table 7 for outcomes of statistical tests.
Figure 10.
Figure 10.
A–F, Representative photomicrographs of a sagittal brain section through the olfactory bulb and rostral pole of the forebrain stained with thionin (A, C, E) and photographs of the accompanying whole brain from which the section was derived (B, D, F). Dashed lines in B, D, and F represent the approximate medial–lateral planes of the Nissl-stained sections in A, C, and E. A, B, intact olfactory bulbs from a SHAM mouse. C, D, complete separation of the olfactory bulbs from the rostral forebrain (olfactory bulbs not shown) in a BULBx mouse. E, F, incomplete separation of the olfactory bulb from the rostral forebrain in a BULBx mouse that passed the BFT and was discarded from the analysis.

Similar articles

Cited by

References

    1. Alberts JR (1974) Producing and interpreting experimental olfactory deficits. Physiol Behav 12:657–670. 10.1016/0031-9384(74)90216-9 - DOI - PubMed
    1. Bartoshuk LM, Klee HJ (2013) Better fruits and vegetables through sensory analysis. Curr Biol 23:R374–378. 10.1016/j.cub.2013.03.038 - DOI - PubMed
    1. Chambliss HO, Van Hoomissen JD, Holmes PV, Bunnell BN, Dishman RK (2004) Effects of chronic activity wheel running and imipramine on masculine copulatory behavior after olfactory bulbectomy. Physiol Behav 82:593–600. 10.1016/j.physbeh.2004.04.064 - DOI - PubMed
    1. Cryan JF, Mombereau C (2004) In search of a depressed mouse: utility of models for studying depression-related behavior in genetically modified mice. Mol Psychiatry 9:326–357. 10.1038/sj.mp.4001457 - DOI - PubMed
    1. Dalton P, Doolittle N, Nagata H, Breslin PA (2000) The merging of the senses: integration of subthreshold taste and smell. Nat Neurosci 3:431–432. 10.1038/74797 - DOI - PubMed

Publication types

Substances

LinkOut - more resources