Meta-Analysis
. 2020 Mar 24;117(12):6476-6483.
doi: 10.1073/pnas.1916903117. Epub 2020 Mar 9.

Active learning narrows achievement gaps for underrepresented students in undergraduate science, technology, engineering, and math

Affiliations
Meta-Analysis

Active learning narrows achievement gaps for underrepresented students in undergraduate science, technology, engineering, and math

Elli J Theobald et al. Proc Natl Acad Sci U S A. .

Abstract

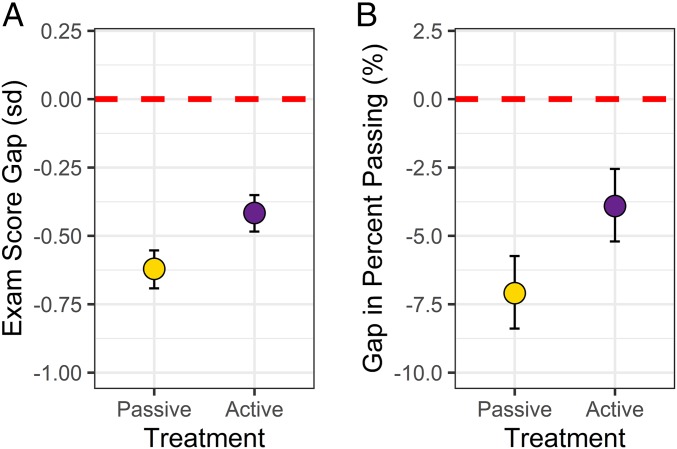
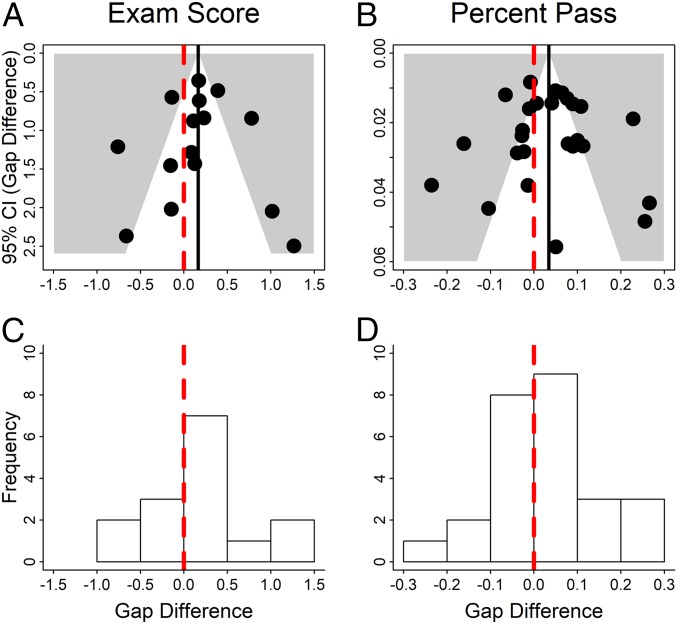
We tested the hypothesis that underrepresented students in active-learning classrooms experience narrower achievement gaps than underrepresented students in traditional lecturing classrooms, averaged across all science, technology, engineering, and mathematics (STEM) fields and courses. We conducted a comprehensive search for both published and unpublished studies that compared the performance of underrepresented students to their overrepresented classmates in active-learning and traditional-lecturing treatments. This search resulted in data on student examination scores from 15 studies (9,238 total students) and data on student failure rates from 26 studies (44,606 total students). Bayesian regression analyses showed that on average, active learning reduced achievement gaps in examination scores by 33% and narrowed gaps in passing rates by 45%. The reported proportion of time that students spend on in-class activities was important, as only classes that implemented high-intensity active learning narrowed achievement gaps. Sensitivity analyses showed that the conclusions are robust to sampling bias and other issues. To explain the extensive variation in efficacy observed among studies, we propose the heads-and-hearts hypothesis, which holds that meaningful reductions in achievement gaps only occur when course designs combine deliberate practice with inclusive teaching. Our results support calls to replace traditional lecturing with evidence-based, active-learning course designs across the STEM disciplines and suggest that innovations in instructional strategies can increase equity in higher education.

Keywords: achievement gaps; active learning; heads-and-hearts hypothesis; individual-participant data metaanalysis; underrepresented minorities.


Conflict of interest statement

The authors declare no competing interest.

Figures

Fig. 1.
Fig. 1.
Average achievement gaps are smaller in active-learning classes than traditional-lecturing classes. (A) Model-based estimates for the average achievement gaps in examination scores across STEM for students from MGS versus non-MGS under traditional lecturing (gold) and active learning (purple). The data are in units of SDs (SI Appendix, SI Materials and Methods). (B) Model-based estimates for the average achievement gaps in percentage of students passing a STEM course for students from MGS versus non-MGS. In both graphs, points show averages and the vertical bars show 95% Bayesian CIs; the dashed horizontal lines represent no gap in performance.
Fig. 2.
Fig. 2.
The magnitude of achievement gaps in active-learning (AL) versus passive-learning (PL) classes varies among studies. Each data point represents a single course; the majority of active-learning courses narrowed the achievement gap. In both panels, the red dashed 1:1 line indicates no difference in the gap between active and passive learning; the white area above the line indicates courses where the gap narrowed. (A) The Upper Left quadrant indicates studies where gaps in examination scores reversed, from students from non-MGS doing better under lecturing to students from MGS doing better under active learning. The Upper Right quadrant represents studies where gaps in examination scores favored students from MGS under both traditional lecturing and active learning. The Bottom Left quadrant signifies studies where students from non-MGS averaged higher examination scores than students from MGS under both passive and active instruction. The Bottom Right quadrant denotes studies where students from non-MGS outperformed students from MGS under active learning, but students from MGS outperformed students from non-MGS under traditional lecturing. Both axes are in units of SDs and indicate difference in performance between MGS and non-MGS students. (B) The Upper Left quadrant indicates studies where gaps in the probability of passing favored students from non-MGS under lecturing but MGS under active learning. The Upper Right quadrant represents studies where the probability of passing was higher for students from MGS versus non-MGS under both passive and active learning. The Lower Left quadrant signifies studies where students from MGS were less likely to pass than students from non-MGS under both modes of instruction. The Lower Right quadrant denotes studies where students from MGS were more likely than non-MGS to pass under traditional lecturing but less likely than non-MGS to pass under active learning. Both axes are percent passing and indicate the difference in performance between MGS and non-MGS students.
Fig. 3.
Fig. 3.
Results appear robust to sampling bias. Funnel plots were constructed with the vertical axis indicating the 95% CI for the difference, under active learning versus lecturing, in (A) examination score gaps or (B) passing rate gaps, and the horizontal axis indicating the change in gaps. The dashed red vertical line shows no change; the solid black line shows the average change across studies. The histograms show data on (C) examination scores (in SDs) and (D) percent passing. The vertical line at 0 shows no change in the achievement gap. If the analyses reported in this study were heavily impacted by the file drawer effect, the distributions in AD would be strongly asymmetrical, with low density on the lower left of each funnel plot and much less density to the left of the no-change line on the histograms.
Fig. 4.
Fig. 4.
Treatment intensity is positively correlated with narrower gaps. High-intensity active-learning courses have narrower achievement gaps between MGS and non-MGS students. In both graphs, points show averages and the vertical bars show 95% Bayesian CIs; the dashed horizontal lines represent no gap in performance. (A) Examination score gap. (B) Gap in percent passing. Intensity is defined as the reported proportion of time students spent actively engaged on in-class activities (SI Appendix, SI Materials and Methods).

Similar articles

Cited by

References

    1. Picketty T., Capital in the Twenty-First Century (Harvard University Press, Cambridge, MA, 2013).
    1. Carnevale A. P., Cheah B., Hanson A. R., The Economic Value of College Majors (Georgetown University, Washington, DC, 2015).
    1. National Science Foundation, National Center for Science and Engineering Statistics, “Women, Minorities, and Persons with Disabilities in Science and Engineering: 2019” (Special Rep. NSF 19-304, National Science Foundation, Alexandria, VA, 2019).
    1. Reardon S. F., “The widening achievement gap between the rich and the poor: New evidence and possible explanations” in Whither Opportunity? Duncan G. J., Murnane R. J., Eds. (Russell Sage Foundation, New York, 2011), pp. 91–115.
    1. National Academies of Sciences, Engineering, and Medicine , Barriers and Opportunities for 2-Year and 4-Year STEM Degrees: Systemic Change to Support Students’ Diverse Pathways (The National Academies Press, Washington, DC, 2016). - PubMed

Publication types

LinkOut - more resources