. 2020 May;32(5):1449-1463.
doi: 10.1105/tpc.19.00891. Epub 2020 Mar 9.

Critical Role of Transcript Cleavage in Arabidopsis RNA Polymerase II Transcriptional Elongation

Affiliations

Critical Role of Transcript Cleavage in Arabidopsis RNA Polymerase II Transcriptional Elongation

Wojciech Antosz et al. Plant Cell. 2020 May.

Abstract

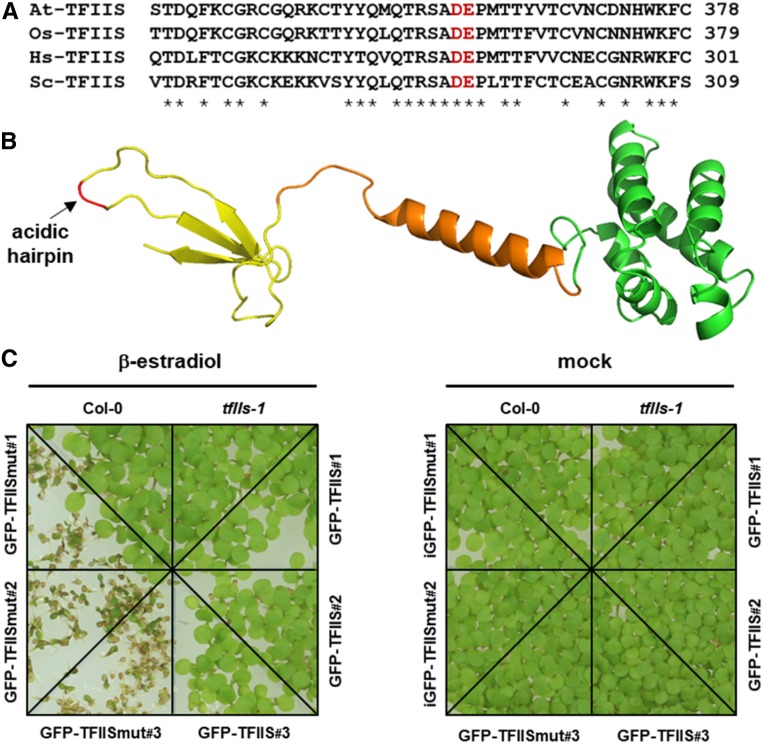
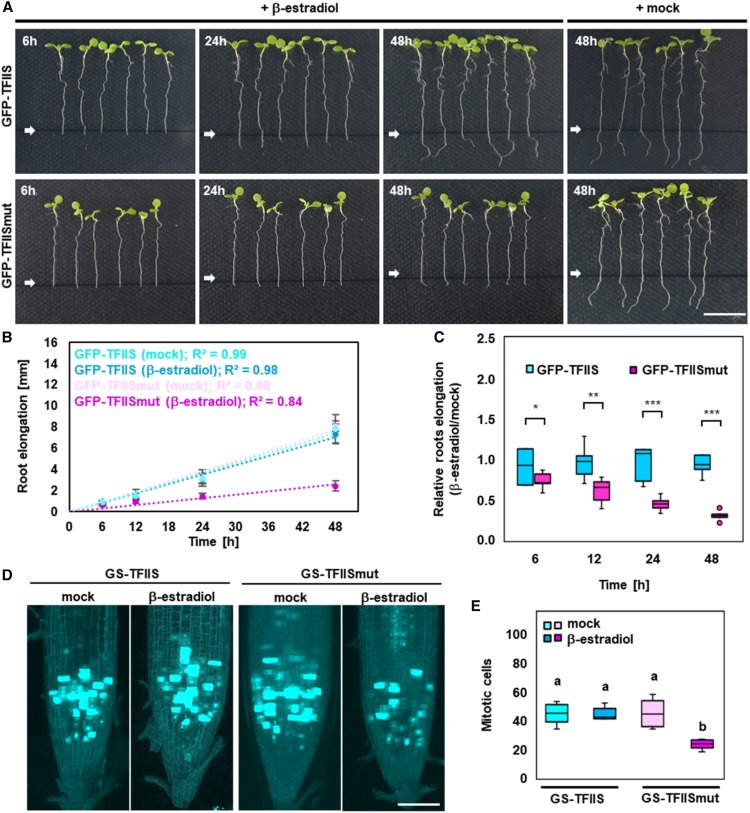
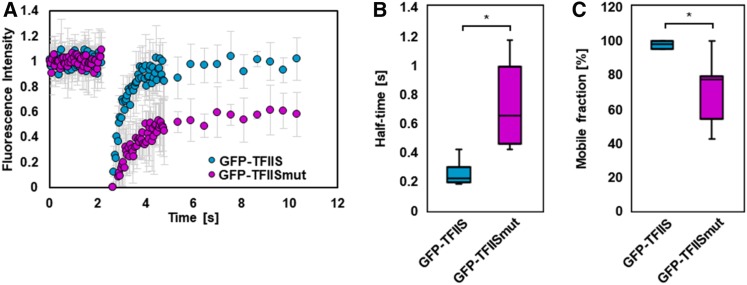
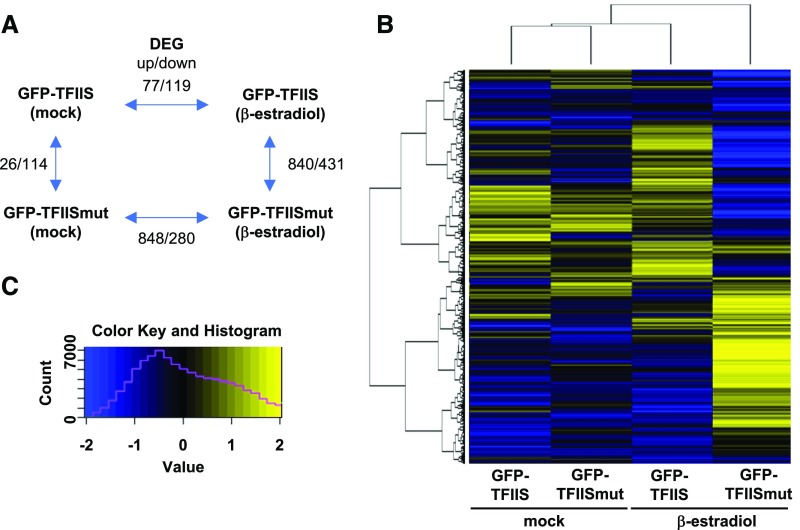
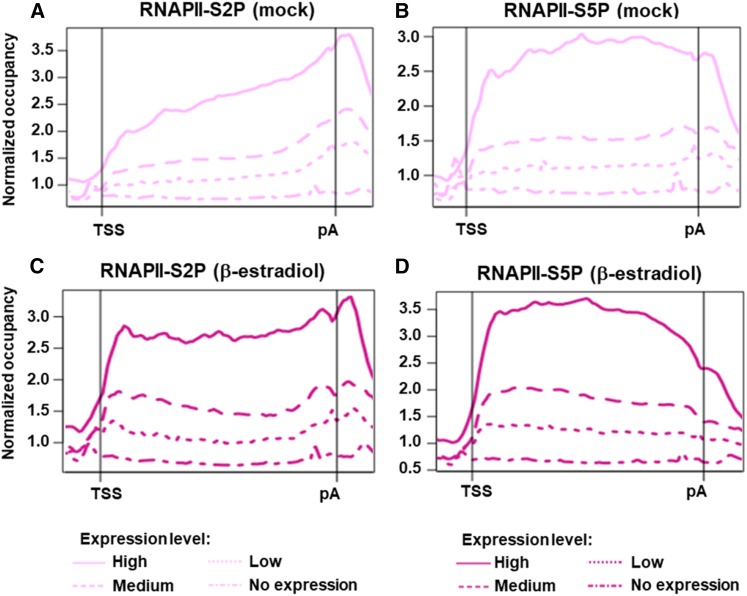
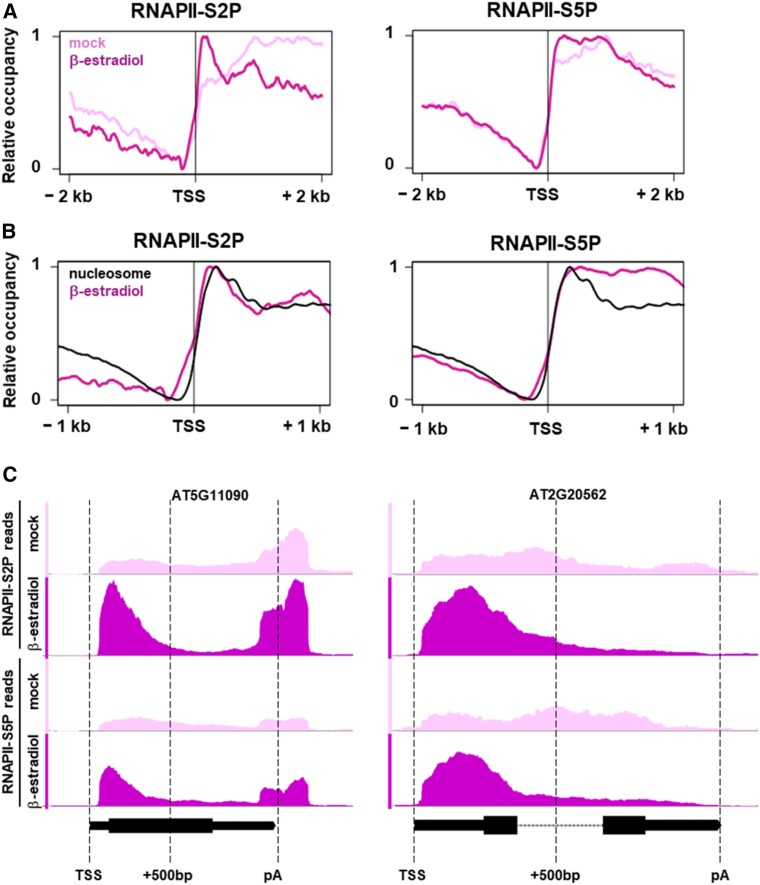
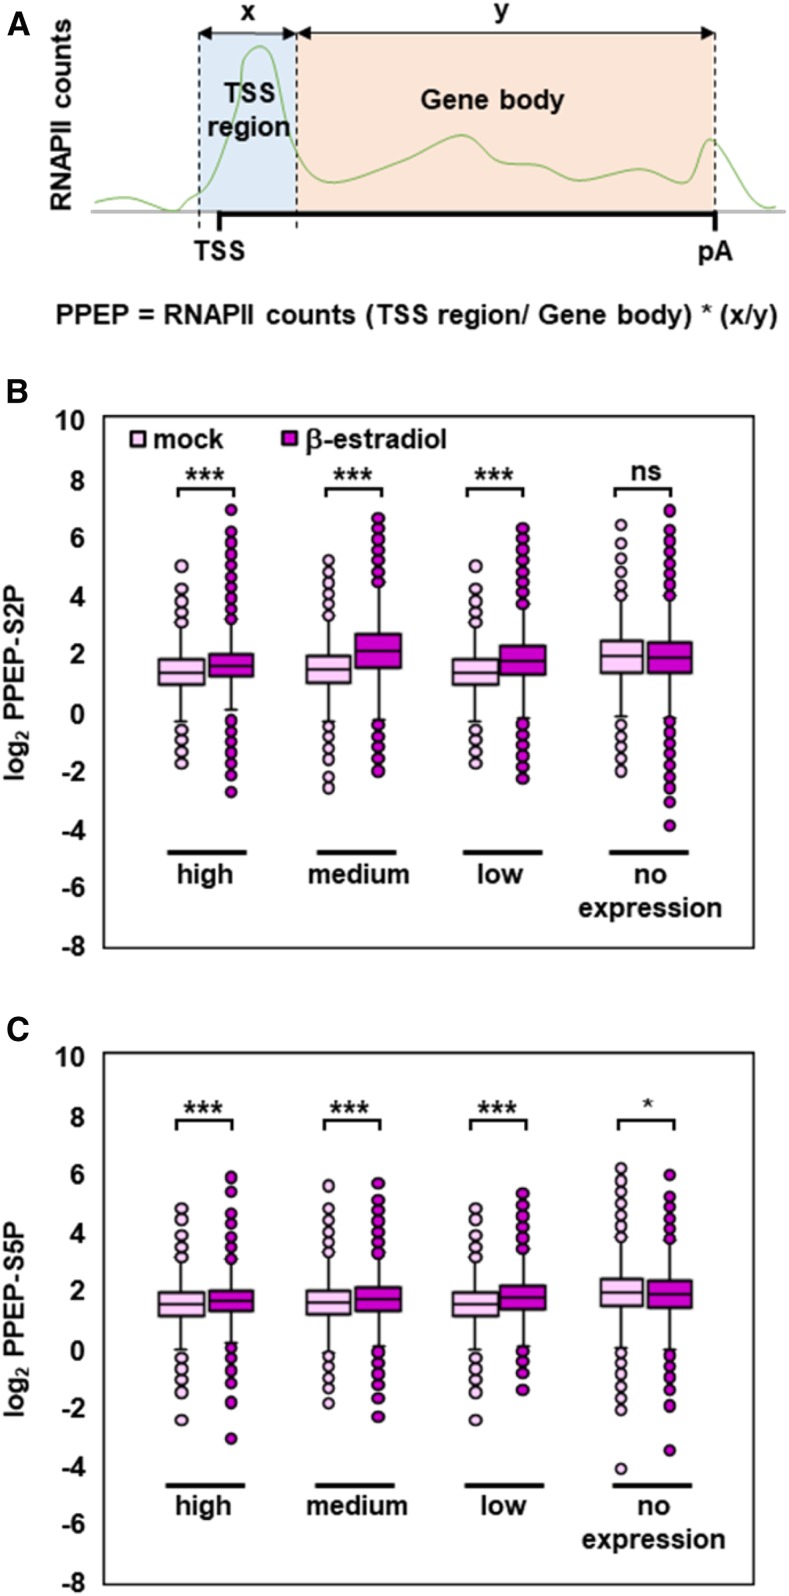
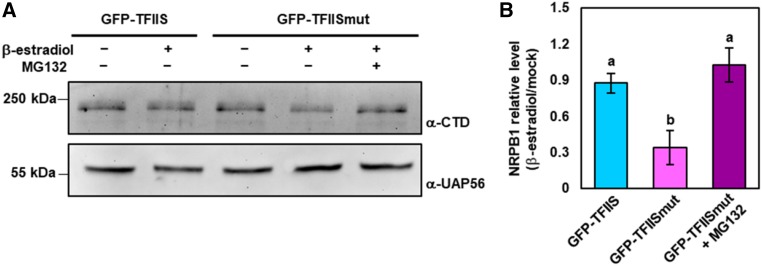
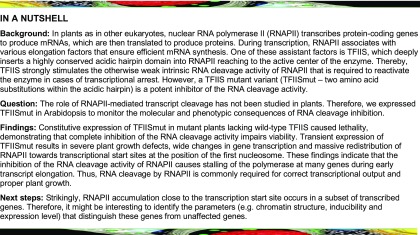
Transcript elongation factors associate with elongating RNA polymerase II (RNAPII) to control the efficiency of mRNA synthesis and consequently modulate plant growth and development. Encountering obstacles during transcription such as nucleosomes or particular DNA sequences may cause backtracking and transcriptional arrest of RNAPII. The elongation factor TFIIS stimulates the intrinsic transcript cleavage activity of the polymerase, which is required for efficient rescue of backtracked/arrested RNAPII. A TFIIS mutant variant (TFIISmut) lacks the stimulatory activity to promote RNA cleavage, but instead efficiently inhibits unstimulated transcript cleavage by RNAPII. We could not recover viable Arabidopsis (Arabidopsis thaliana) tfIIs plants constitutively expressing TFIISmut. Induced, transient expression of TFIISmut in tfIIs plants provoked severe growth defects, transcriptomic changes and massive, transcription-related redistribution of elongating RNAPII within transcribed regions toward the transcriptional start site. The predominant site of RNAPII accumulation overlapped with the +1 nucleosome, suggesting that upon inhibition of RNA cleavage activity, RNAPII arrest prevalently occurs at this position. In the presence of TFIISmut, the amount of RNAPII was reduced, which could be reverted by inhibiting the proteasome, indicating proteasomal degradation of arrested RNAPII. Our findings suggest that polymerase backtracking/arrest frequently occurs in plant cells, and RNAPII-reactivation is essential for correct transcriptional output and proper growth/development.


Figures

Figure 1.
Figure 1.
Induced Expression of TFIISmut in tfIIs Mutant Background Severely Affects Plant Growth. (A) Amino acid sequence alignment of the C-terminal part of TFIIS from Arabidopsis (At), rice (Os), human (Hs), and the yeast S. cerevisiae (Sc). Asterisks indicate conserved residues and the invariant acidic residues (D359, E360 indicated in red) that were mutated in this work (the corresponding residues were mutated in other studies [Jeon et al., 1994; Kettenberger et al., 2004; Sigurdsson et al., 2010; Imashimizu et al., 2013]). (B) Cartoon representation of the computational structure model of domains II and III of Arabidopsis TFIIS. The model (C-score = 0.82) was generated using the I-TASSER server (Yang and Zhang, 2015). Domain II is indicated in green, the interdomain linker in orange, domain III in yellow, and the position of the two invariant acidic hairpin residues (changed to Ala residues in TFIISmut) is highlighted in red and marked by an arrow. (C) Growth of Arabidopsis plants expressing TFIISmut is severely impaired. Seven-DAS plants of three independent plant lines each expressing GFP-TFIISmut or GFP-TFIIS were grown in comparison to the Col-0 wild type on MS medium under inductive conditions (+β-estradiol) or mock-treated (ethanol).
Figure 2.
Figure 2.
Plants Expressing TFIISmut Exhibit Reduced Growth of the Primary Root and Decreased Cell Proliferation. (A) Inhibition of root growth upon expression of TFIISmut. Eight-DAS plants were transferred onto MS plates containing β-estradiol to induce expression of GFP-TFIISmut and GFP-TFIIS, or mock-treated. Images were taken at the indicated times. White arrow (and black line) indicates the position of the root tip at the time of transfer (0 h). Root elongation was measured to determine absolute (B) and relative (C) elongation. (B) Dots represent mean values ± sd and dotted lines represent linear regression (n = 6). (C) Bars represent mean values ± sd and asterisks indicate the outcome of the Student’s t test: *P < 0.05, **P < 0.01, ***P < 0.001. (D) CLSM analysis of GFP fluorescence of root tips of 5-DAS plants induced (or mock-treated) for 24 h to express GS-TFIIS or GS-TFIISmut and harboring the pCYCB1;1-GFP reporter. (E) Bars represent mean values ± sd of the number of mitotic, GFP-expressing cells (n = 5 plants per line/condition). Different characters (a, b) indicate the outcome of a multicomparison Tukey’s test (P < 0.05).
Figure 3.
Figure 3.
Nuclear Mobility of TFIISmut Is Markedly Lower Than That of TFIIS. (A) to (C) FRAP analysis of Arabidopsis PSB-D cells induced for 24 h to express TFIISmut or TFIIS. Mean fluorescence recovery curves ± sd (full-scale normalization) representing 40 prebleach and 50 postbleach time points (A). Calculated t1/2 (B) and Mf (C) represented as box plots with *P < 0.05 according to Student’s t test.
Figure 4.
Figure 4.
Expression of TFIISmut Leads to Major Transcriptomic Changes. (A) Schematic representation of the number of DEGs (up/down) between the analyzed plant lines/conditions. (B) Heat map (n = 15,836) of the transcriptomic changes between the analyzed plant lines/conditions. Only genes with FPKM ≥ 5 in at least one line/condition were considered and the hierarchical clustering is indicated on the left. (C) Heat map legend with yellow-blue gradient indicating the log2FPKM [−2; 2]. The magenta line indicates the number of values in a given color range.
Figure 5.
Figure 5.
The Genomic Occupancy of Elongating RNAPII Is Related to the Corresponding Transcript Levels and the Distribution within Transcribed Regions Is Altered upon Expression of TFIISmut. (A) to (D) As indicated, gene-averaged profiles represent the distribution of RNAPII-S2P ([A] and [C]) and RNAPII-S5P ([B] and [D]) over transcribed regions (TSS – pA) according to the ChIP-seq data of 10-DAS plants induced for 24 h to express GFP-TFIISmut ([C] and [D]; dark magenta) or mock-treated ([A] and [C]; light magenta). Profiles represent genes with no (18,754), low (3,488), medium (6,975), or high (3,488) transcript levels based on the FPKM values determined by RNA-seq.
Figure 6.
Figure 6.
In the Presence of TFIIS, Elongating RNAPII Accumulates Downstream of the TSS at a Position Overlapping with the +1 Nucleosome. (A) Gene-averaged profiles of the RNAPII-S2P and RNAPII-S5P distribution around the TSS according to ChIP-seq data of 10-DAS plants induced for 24 h to express GFP-TFIISmut (dark magenta) or mock-treated (light magenta). Profiles represent 33,574 and 33,560 loci for RNAPII-S2P and RNAPII-S5P, respectively. (B) The black line represents the nucleosome occupancy of 14-DAS plants calculated from MNase-seq data (Li et al., 2014) that was combined with the profiles of RNAPII-S2P and RNAPII-S5P after induced GFP-TFIISmut expression. (C) ChIP-seq profiles of RNAPII-S2P and RNAPII-S5P at the At5g11090 and At2g20562 loci with increased PPEP values upon β-estradiol versus mock treatment. Plots were generated with the Integrative Genomics Browser using representative biological replicates. In gene models, thin bars represent UTRs; thick bars represent exons; dotted lines represent introns.
Figure 7.
Figure 7.
TFIISmut-Induced Changes in PPEP Are Related To Transcript Levels. (A) Scheme depicting the promoter proximal region (0 to +500 bp, blue) and the rest of the transcribed region to pA (orange), as well as calculation of PPEP. (B) and (C) Changes in PPEP-S2P (B) and PPEP-S5 (C) upon TFIISmut expression versus mock treatment (dark magenta versus bright magenta, respectively) were calculated for genes with no (18,754), low (3,488), medium (6,975), or high (3,488) transcript levels based on FPKM values determined by RNA-seq. PPEP-S2P and PPEP-S5 values are visualized by box plots; asterisks indicate the outcome of the Student’s t test: *P < 0.05, ***P < 0.001.
Figure 8.
Figure 8.
Upon TFIISmut Expression, the Amount of the Large Subunit NRPB1 of RNAPII Is Decreased by Proteasomal Degradation. (A) Ten-DAS plants inducibly expressing GFP-TFIIS or GFP-TFIISmut were treated for 24 h with the inducer β-estradiol (or mock-treated) and the proteasome inhibitor MG132 as indicated. All plants were additionally co-treated with cycloheximide. Total protein extracts of these plants were analyzed by immunoblotting using an antibody directed against the NRPB1-CTD, and as loading control, an antibody directed against the RNA helicase UAP56. (B) Band intensities were quantified using the software ImageJ (https://imagej.nih.gov/ij/). Colored bars represent mean values ± sd of three independent experiments. Data were statistically analyzed using one-way ANOVA and different characters (a, b) indicate the outcome of a multicomparison Tukey’s test (P < 0.05).
None

References

    1. Adelman K., Marr M.T., Werner J., Saunders A., Ni Z., Andrulis E.D., Lis J.T.(2005). Efficient release from promoter-proximal stall sites requires transcript cleavage factor TFIIS. Mol. Cell 17: 103–112. - PubMed
    1. Anders S., Pyl P.T., Huber W.(2015). HTSeq--a Python framework to work with high-throughput sequencing data. Bioinformatics 31: 166–169. - PMC - PubMed
    1. Antosch M., Schubert V., Holzinger P., Houben A., Grasser K.D.(2015). Mitotic lifecycle of chromosomal 3xHMG-box proteins and the role of their N-terminal domain in the association with rDNA loci and proteolysis. New Phytol. 208: 1067–1077. - PubMed
    1. Antosz W., et al. (2017). The composition of the Arabidopsis RNA polymerase II transcript elongation complex reveals the interplay between elongation and mRNA processing factors. Plant Cell 29: 854–870. - PMC - PubMed
    1. Archambault J., Lacroute F., Ruet A., Friesen J.D.(1992). Genetic interaction between transcription elongation factor TFIIS and RNA polymerase II. Mol. Cell. Biol. 12: 4142–4152. - PMC - PubMed

Publication types

MeSH terms