. 2020 Mar 9;11(1):1284.
doi: 10.1038/s41467-020-14923-8.

Perinatal inflammation influences but does not arrest rapid immune development in preterm babies

Affiliations

Perinatal inflammation influences but does not arrest rapid immune development in preterm babies

S Kamdar et al. Nat Commun. .

Abstract

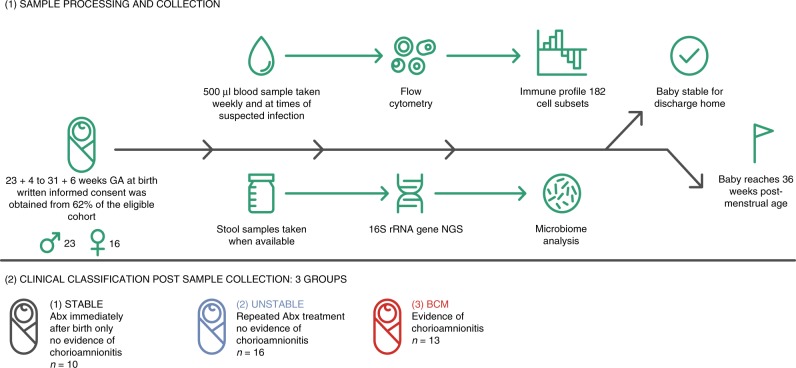
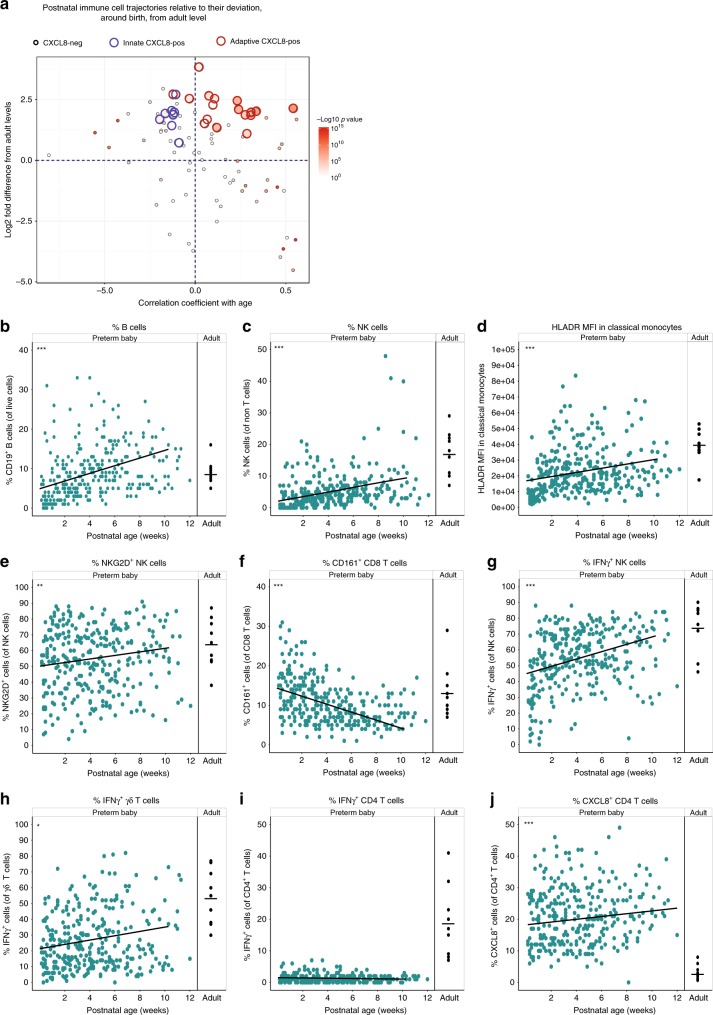
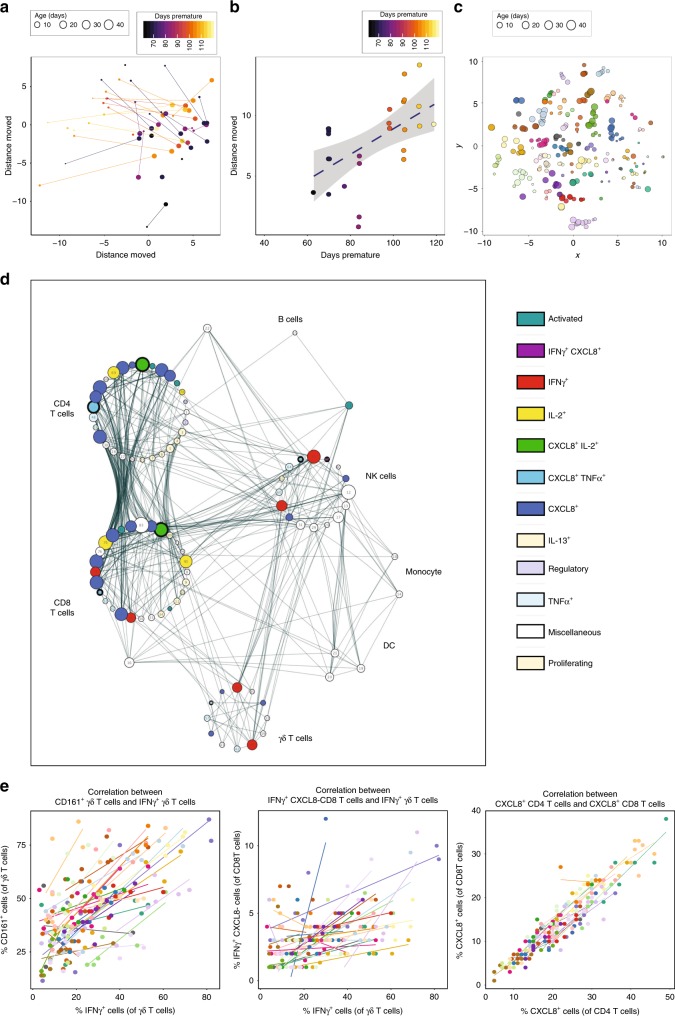
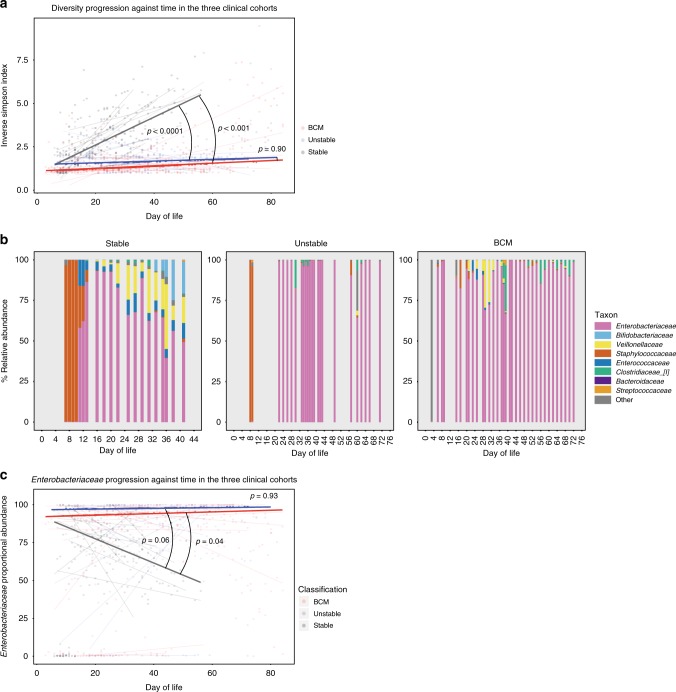
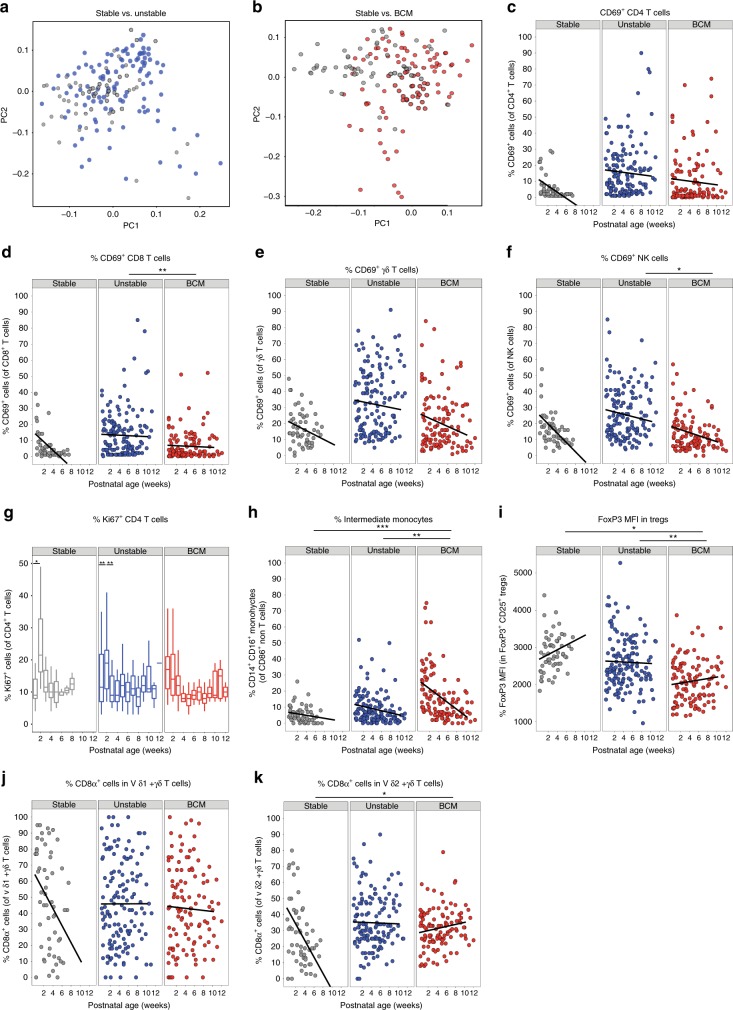
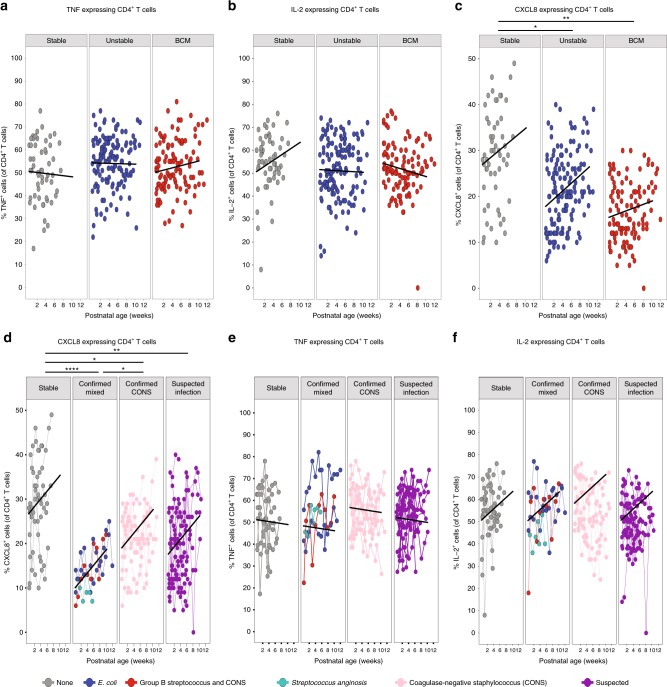
Infection and infection-related complications are important causes of death and morbidity following preterm birth. Despite this risk, there is limited understanding of the development of the immune system in those born prematurely, and of how this development is influenced by perinatal factors. Here we prospectively and longitudinally follow a cohort of babies born before 32 weeks of gestation. We demonstrate that preterm babies, including those born extremely prematurely (<28 weeks), are capable of rapidly acquiring some adult levels of immune functionality, in which immune maturation occurs independently of the developing heterogeneous microbiome. By contrast, we observe a reduced percentage of CXCL8-producing T cells, but comparable levels of TNF-producing T cells, from babies exposed to in utero or postnatal infection, which precedes an unstable post-natal clinical course. These data show that rapid immune development is possible in preterm babies, but distinct identifiable differences in functionality may predict subsequent infection mediated outcomes.


Conflict of interest statement

The authors declare no competing interests.

Figures

Fig. 1
Fig. 1. Schematic representing study design.
Written informed consent was obtained from parents before 72 h of age and of the parents approached, 62% agreed to enter the study as described in the figure.
Fig. 2
Fig. 2. Phenotypic and functional maturation of distinct immune parameters.
Longitudinal PBMC samples from 39 preterm babies were phenotyped for 186 different immune populations by flow cytometry following surface and intracellular staining. For cytokine detection, samples were activated in vitro with PI (4 h, in the presence of BFA) prior to staining. a Postnatal Immune cell trajectories relative to their deviation from the first infant sample taken, compared with adult levels. Position along y-axis indicates deviation from adult (the log 2 fold difference) in the first sample; position along x-axis indicates whether the population has increased or decreased significantly in the infant over time. Thus, immune populations in the top left quadrant start higher than adult levels and then decrease over time towards the adult level. Populations in the bottom right start below adult levels and increase over time towards that of the adult. Colour indicates—log 10 p value (Wilcoxon’s matched-pairs signed-rank test) for correlation with age with large circles indicating CXCL8-producing cell types. Among the CXCL8-producing populations, the red outline indicates NK and γδ T cells, whereas the blue outline CD4 or CD8 αβ T cells. bj Changes in individual immune parameters over time depicted by scatter plots showing frequencies/MFI (as indicated) in preterm babies (left panel; cyan circles) as a function of postnatal age compared to adults (right panel; black circles). b CD19+ B cells, c HLADR MFI in classical monocytes, d NK cells, e NKG2D+ NK cells, f CD161+ CD8 T cells, g IFN-γ+ NK cells, h IFN-γ+ γδ T cells, i IFN-γ+ CD4 T cells, and j CXCL8+ CD4 T cells. In the figure, cyan circles represent a pool of longitudinal samples from 39 preterm babies where each circle represents an individual sample and on average there are eight longitudinal samples per baby. Black circles are a pool of samples from nine adults. ***p < 0.001, **p < 0.01, and *p < 0.05 as determined by linear mixed-effect modelling using the lmer package in R. Source data are provided as a Source Data file.
Fig. 3
Fig. 3. Development of whole immune profiles and correlations.
Longitudinal PBMC samples were phenotyped by flow cytometry as described. a, b Analyses of the immune parameters from 39 preterm babies shows that the immune profile of extremely preterm babies (lighter colour) travels a longer distance, but on the same trajectory compared to their less preterm counterparts (darker colour) as depicted by: a PCA of the immune profile of samples taken in the first week (small circle, mean = 3.8 days) compared to that of the sample taken 5 weeks later (large circle, mean = 37 days) for each baby. The colour gradient represents how many days preterm the baby was at birth (counting down from 40 weeks). Each circle represents a sample from an individual baby and the size represents postnatal age of the baby at sampling. Lines link individual babies. b Scatter plot quantifying the Euclidian distance moved in PC1 and PC2 for each baby. The colour gradient represents how many days preterm the baby was at birth. Each symbol represents an individual baby. c t-Distributed stochastic neighbour embedding (tSNE) analysis of the immune parameters shows that babies have their own individual profile. Each circle represents a sample from an individual baby (the size of the circle depicts the postnatal age of the baby when the sample was taken) and each colour represents longitudinal samples from the same baby. d Network represents statistically significant (p < 0.008) Spearman’s correlation coefficients (R ≥ 0.3 or R ≤ −0.3) between immune parameters. Each node represents an immune parameter. Nodes are grouped by lineage and coloured by function; node size relates to the number of relationships. If any parameters were inherently related to other parameters due to the nature of flow analysis, only one parameter (of a correlated pair) was used in the correlation plot. e Plots depicting correlation between frequency of (left panel) IFN-γ+ γδ T cells and CD161-expressing γδ T cells; (middle panel) IFN-γ+ CXCL8 CD8 T cells and IFN-γ+ γδ T cells; and (right panel) CXCL8-producing CD4 and CD8 T cells. The data shown are a pool of longitudinal samples from 39 preterm babies, where each circle represents an individual sample and on average there are eight longitudinal samples per baby. Individual babies are in different colours. Source data are provided as a Source Data file.
Fig. 4
Fig. 4. Microbiome development.
Faecal samples (713) were longitudinally collected from 34 babies across the duration of the study. Bacterial DNA was extracted, and the 16S rRNA gene (hypervariable region V4) was amplified, sequenced and compared against the sequence database to ascertain the relative abundance of bacterial taxa in samples. Participants were classified into three groups based on their clinical state: stable, unstable and those born to mothers with chorioamnionitis (BCM). a The progression of diversity against postnatal age across the three groups (stable—grey; unstable—blue; BCM—red). Dot plot represents individual sample diversity indices. Thin lines represent individual participants’ regression coefficients through their diversity data points, as assessed by Theil–Sen estimator. Thick lines represent the median/mean of the individual trajectories within each clinical group. b Stacked bar charts of relative abundance of taxa in typical infants from the three clinical groups. Only taxa with >1% mean abundance across all samples are represented. c Enterobacteriaceae relative abundance against postnatal age across the three groups (stable—grey; unstable—blue; BCM—red). Dot plot represents individual sample Enterobacteriaceae proportions. Thin lines represent individual participants’ regression coefficients through their Enterobacteriaceae proportions data points, as assessed by Theil–Sen estimator. Thick lines represent the median/mean of the individual trajectories within each clinical group. Source data are provided as a Source Data file.
Fig. 5
Fig. 5. Immune parameters altered by different pre- and/or postnatal exposures.
Longitudinal PBMC samples from 39 preterm babies were phenotyped for 186 different immune populations by flow cytometry following surface and intracellular staining. For cytokine detection, samples were activated in vitro with PI (4 h, in the presence of BFA) prior to staining. PCA of 186 immune parameters from longitudinal samples derived from: a stable (grey circles; n = 10 babies) and unstable (blue circles, n = 16) babies. b Stable (grey circles; n = 10) and BCM (red circles, n = 13) babies. In cf, scatter plots depict frequencies of CD69+ cells in stable babies (left panel; grey circles, n = 10), unstable babies (middle panel; blue circles, n = 16) and BCM babies (right panel; red circles, n = 13) as a function of postnatal age: c CD69+ CD4 T cells, d CD69+ CD8 T cells, e CD69+ γδ T cells, f CD69+ NK cells are depicted from the three clinical groups. g Proliferation (as depicted by the boxplot showing frequency of Ki67 expression in CD4+ T cells) was elevated immediately post birth in infants born to mothers with chorioamnionitis, whereas stable (and to a lesser extent unstable) infants showed a proliferative burst at around 14 days of age. In this box-and-whisker plot, horizontal bars indicate the median, boxes indicate 25th to 75th percentile, and whiskers indicate 10th and 90th percentile. Compared to stable babies, unstable and BCM babies show significantly higher frequencies of intermediate monocytes (h) and significantly lower FOXP3 MFI in Tregs (i) and higher frequencies of CD8α-expressing γδ T cells over time in both j Vδ1+ γδ T cells and k Vδ2+ γδ T cells. Data shown are a pool of longitudinal samples from each clinical group where on average there are eight samples per baby in the stable cohort (n = 10) and nine samples per baby in the unstable cohort (n = 16) and the BCM cohort (n = 13). For all figures except g, ***p < 0.001, **p < 0.01 and *p < 0.05 as determined by linear mixed-effect modelling using the lmer package in R. For g, **p < 0.01 and *p < 0.05 as determined by a non-parametric Wilcoxon’s matched-pairs signed-rank test. Source data are provided as a Source Data file.
Fig. 6
Fig. 6. Unstable infants have significantly reduced CXCL8-producing T cells compared to stable babies.
Longitudinal PBMC samples from 39 preterm babies were activated in vitro with PI (4 h, in the presence of BFA) and expression of CXCL8, TNF and IL-2 assessed by flow cytometry. Scatter plots showing frequencies of a TNF, b IL-2 and c CXCL8 in stable babies (left panel; grey circles, n = 10), unstable babies (middle panel; blue circles, n = 16) and BCM babies (right panel; red circles, n = 13) as a function of postnatal age. In ac, data shown are a pool of longitudinal samples from each clinical group where each circle represents a longitudinal sample from an individual baby and on average there are six samples per baby in the stable cohort and nine samples per baby in the unstable cohort and the BCM cohort. Blood culture-positive bacteraemias were separated into those from coagulase-negative staphylococci (CoNS) and other bacteria as CoNS infections are generally considered to be less severe with lower mortality rates. Scatter plots showing the frequencies of d CXCL8, e TNF and f IL-2 in stable babies (far left panel; grey circles, n = 10 babies with a mean of eight longitudinal samples per baby), babies with microbiologically confirmed infections (second panel; n = 4 with a mean of 11 longitudinal samples per baby), babies with coagulase-negative staphylococcal infections (CoNS) (third panel, n = 9 with a mean of 10 longitudinal samples per baby) and babies with suspected infections (far right panel; n = 16 with mean of seven longitudinal samples per baby). The colour of the circles depicts the type of infection as described in the figure. In df, each circle represents a longitudinal sample from an individual baby and linked circles represent longitudinal samples from the same baby. ***p < 0.001, **p < 0.01 and *p < 0.05 as determined by linear mixed-effect modelling using the lmer package in R. Source data are provided as a Source Data file.

References

    1. Berrington JE, Hearn RI, Bythell M, Wright C, Embleton ND. Deaths in preterm infants: changing pathology over 2 decades. J. Pediatr. 2012;160:49–53 e41. doi: 10.1016/j.jpeds.2011.06.046. - DOI - PubMed
    1. Patel RM, et al. Causes and timing of death in extremely premature infants from 2000 through 2011. N. Engl. J. Med. 2015;372:331–340. doi: 10.1056/NEJMoa1403489. - DOI - PMC - PubMed
    1. group, E.t.i. Enteral lactoferrin supplementation for very preterm infants: a randomised placebo-controlled trial. Lancet393, 423–433 (2019). - PMC - PubMed
    1. Olin A, et al. Stereotypic immune system development in newborn children. Cell. 2018;174:1277–1292 e1214. doi: 10.1016/j.cell.2018.06.045. - DOI - PMC - PubMed
    1. Lee AH, et al. Dynamic molecular changes during the first week of human life follow a robust developmental trajectory. Nat. Commun. 2019;10:1092. doi: 10.1038/s41467-019-08794-x. - DOI - PMC - PubMed

Publication types