. 2020 Mar 9;11(1):1266.
doi: 10.1038/s41467-020-14993-8.

Endophilin-A coordinates priming and fusion of neurosecretory vesicles via intersectin

Affiliations

Endophilin-A coordinates priming and fusion of neurosecretory vesicles via intersectin

Sindhuja Gowrisankaran et al. Nat Commun. .

Abstract

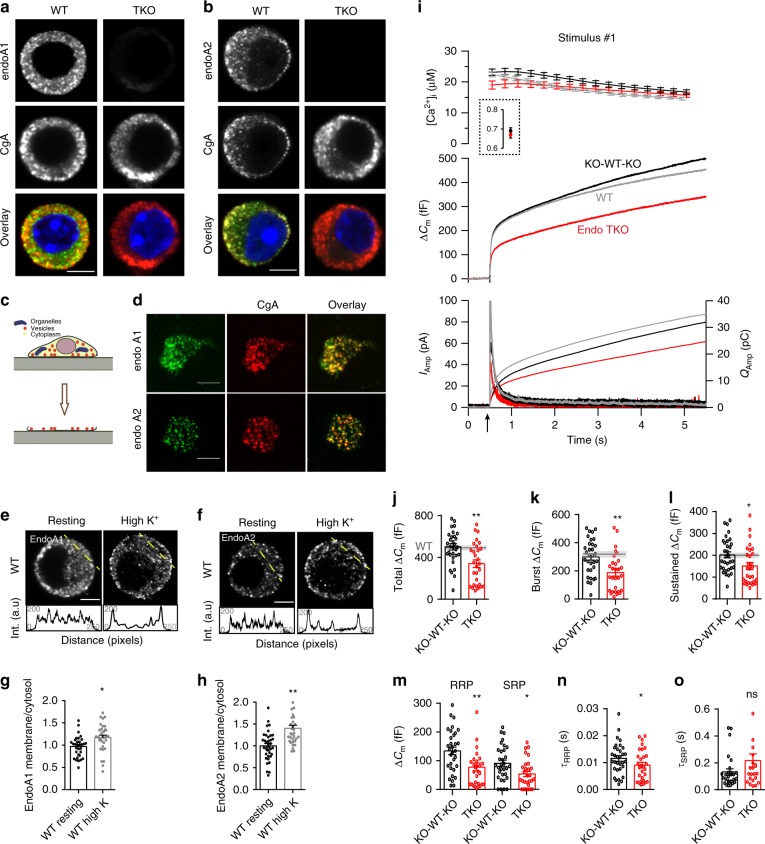
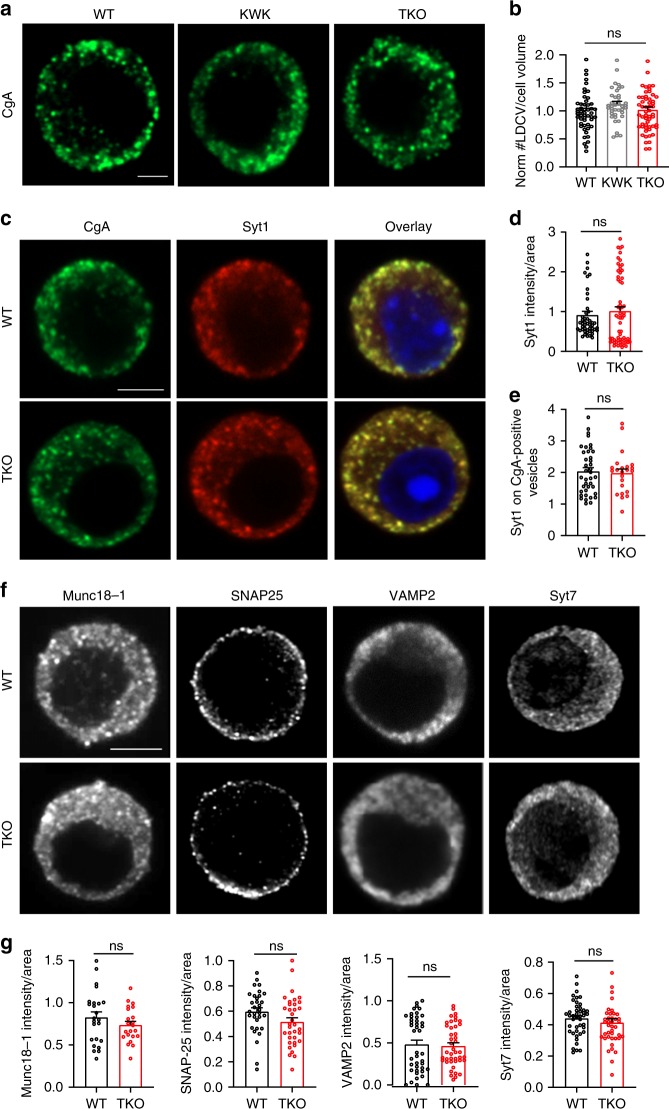
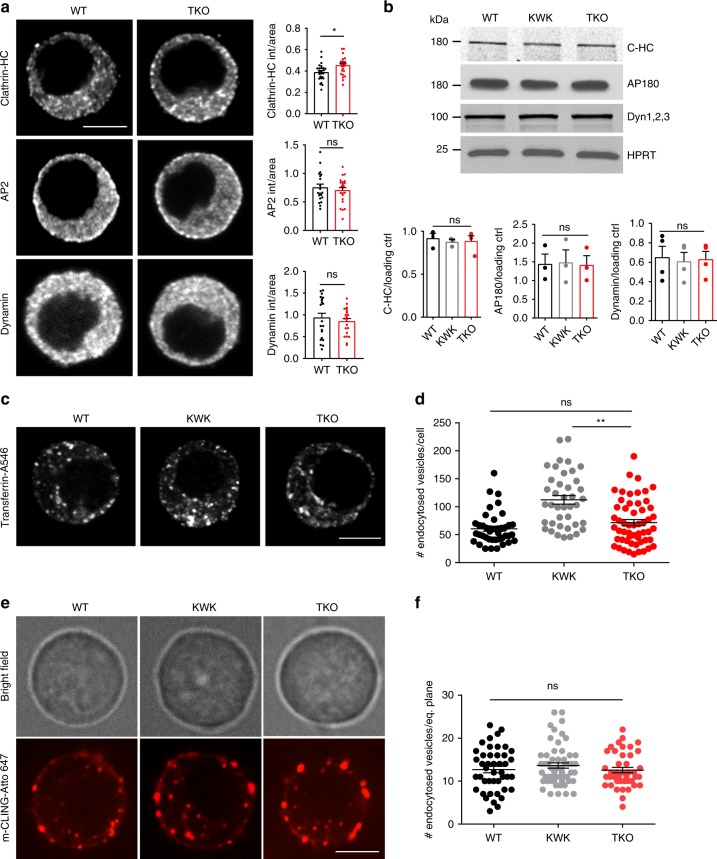
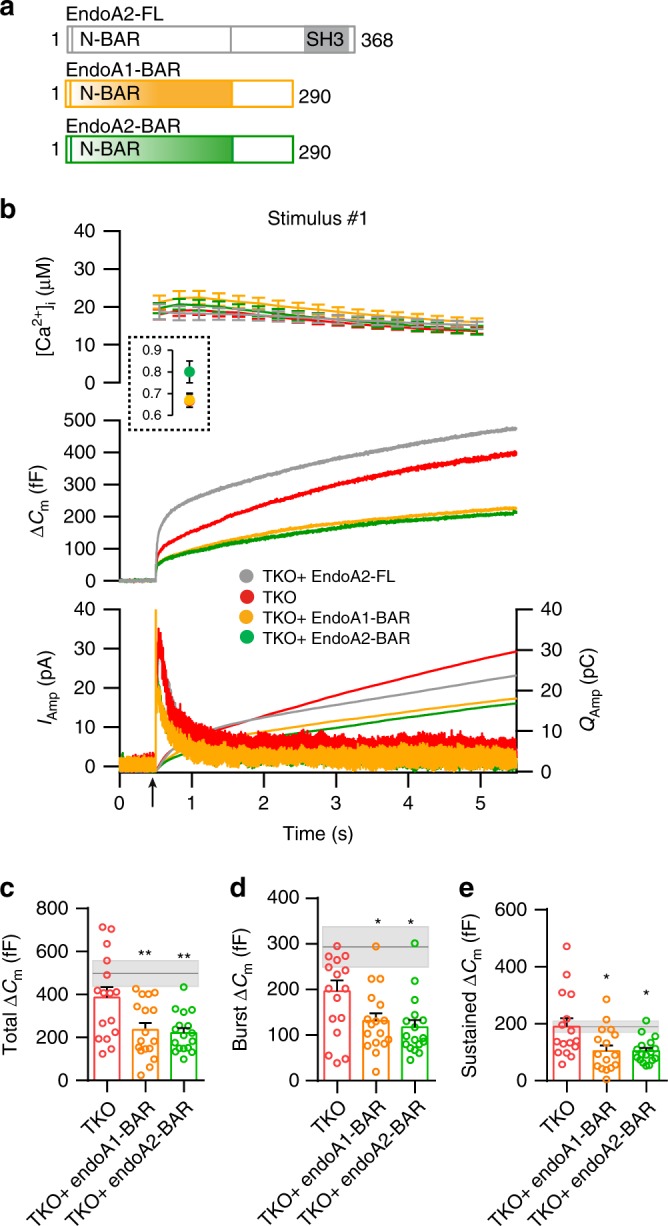
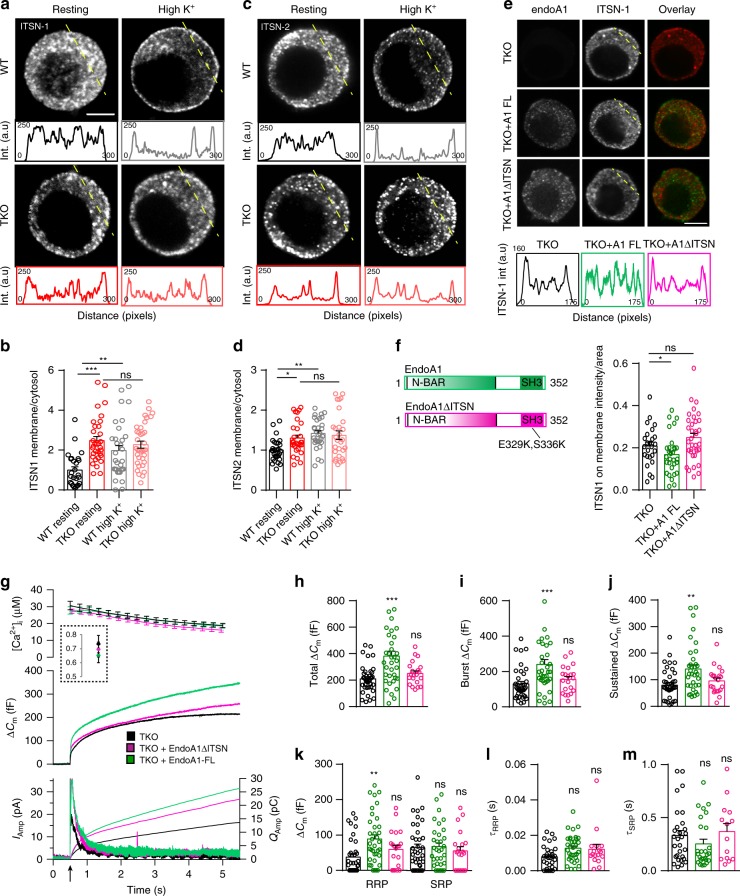
Endophilins-A are conserved endocytic adaptors with membrane curvature-sensing and -inducing properties. We show here that, independently of their role in endocytosis, endophilin-A1 and endophilin-A2 regulate exocytosis of neurosecretory vesicles. The number and distribution of neurosecretory vesicles were not changed in chromaffin cells lacking endophilin-A, yet fast capacitance and amperometry measurements revealed reduced exocytosis, smaller vesicle pools and altered fusion kinetics. The levels and distributions of the main exocytic and endocytic factors were unchanged, and slow compensatory endocytosis was not robustly affected. Endophilin-A's role in exocytosis is mediated through its SH3-domain, specifically via a direct interaction with intersectin-1, a coordinator of exocytic and endocytic traffic. Endophilin-A not able to bind intersectin-1, and intersectin-1 not able to bind endophilin-A, resulted in similar exocytic defects in chromaffin cells. Altogether, we report that two endocytic proteins, endophilin-A and intersectin-1, are enriched on neurosecretory vesicles and regulate exocytosis by coordinating neurosecretory vesicle priming and fusion.


Conflict of interest statement

The authors declare no competing interests.

Figures

Fig. 1
Fig. 1. Endophilins are enriched at neurosecretory vesicles and required for efficient chromaffin cell exocytosis.
a, b Representative confocal images of WT and endophilin TKO mouse chromaffin cells stained for endophilin-1 (a) or endophilin-2 (b), and co-labeled with chromogranin-A (CgA), a LDCV marker. Scale bar 3 µm. For colocalization quantification, see Suppl. Fig 1c, d. c Plasma membrane sheet generation from cultured cells. d Representative plasma membrane sheets from chromaffin cells stained for endophilin-1 (top) or endophilin-2 (bottom) along with CgA. Scale bar 2 µm. Colocalization coefficient: 0.28 ± 0.13 endophilin-1 (N = 3 exp.; n = 26 sheets), 0.30 ± 0.11 endophilin-2 (N = 3 exp.; n = 20 sheets). eh Upon stimulation, higher levels of endophilin-1 (e) and endophilin-2 (f) were present at the plasma membrane, as shown by intensity profiles along the lines indicated on the cells. Scale bar 3 µm. g, h Quantifications of endophilin redistribution. Endophilin-1: N = 3 exps; n = 32 (WT), 33 (TKO) cells, p = 0.005; Endophilin-2: N = 3 exps, n = 38 (WT) and 33 (TKO) cells, p < 0.0001, unpaired two-tailed t-test. (i) Exocytosis (indicated by the arrow) was reduced in endophilin TKO cells (red traces; N = 4 exps, 6 mice (29 cells)) compared to endophilin KOWTKO littermate cells (black traces; N = 4 exps, 6 mice (32 cells) and to (non-littermate) WT C57BL6/J cells (gray traces; N = 4 exps, 6 mice (60 cells)). i Top: intracellular calcium levels: The inset shows pre-stimulation calcium levels. Middle: averaged membrane capacitance changes upon Ca2+-induced exocytosis. Bottom: mean amperometric current (left axis) and cumulative charge (right axis). jl Analysis of capacitance (KOWTKO: N = 4 exps, 6 mice (32) and TKO: N = 4 exps, 6 mice (29)) revealed an overall reduction of exocytosis. Gray line: the mean of 39 WT cells (non-littermate controls), shaded area: SEM. Note changes in burst (exocytosis within 1 s; k) and sustained phase of release (l). m Both RRP and SRP were reduced in TKO cells. n Fusion kinetics of RRP vesicles was faster in TKO cells. o Although on average slower, the SRP fusion kinetics constant was not significantly changed in TKO cells (mo, N = 4, KOWTKO 6 mice (30) and TKO 6 mice (29)). Unpaired two-sided t-test, *p < 0.05, **p < 0.01, ns not significant. Error bars denote SEM.
Fig. 2
Fig. 2. Expression of endophilin 1 and endophilin 2 rescued exocytosis in endophilin TKO cells.
a, b Expression of endophilin 1 and endophilin 2 full-length rescued the exocytic defects seen in endophilin TKO cells. Panel arranged as in Fig. 1i, with three groups: endophilin TKO (red traces; N = 4, 4 mice (24 cells)), TKO + endophilin 1 (green traces; N = 4, 4 mice (23 cells)) and TKO + endophilin 2 (blue traces; N = 4, 4 mice (25 cells)). Control KOWTKO data from Fig. 1I (gray trace; N = 4, 6 mice (32 cells)) are superimposed. Note that both endophilin 1 and endophilin 2 can rescue exocytosis; rescue with endophilin 2 is indistinguishable from control KOWTKO cells. ce Burst and sustained component, as well as RRP size, were rescued upon expression of endophilin 1 and 2, respectively. f, g The altered kinetics of the RRP in TKO was rescued (f), while the time constant of the SRP was not significantly changed (g) upon expression of endophilin 1 and 2, respectively (bg) Kruskal–Wallis test with Dunn’s multiple comparison test. h Exemplary traces from amperometric recordings of endophilin TKO and endophilin TKO expressing endophilin 2. Insets show magnified view. i Schematic of analyzed amperometric spike parameters. jq Amperometry analysis (210 s recording per cell) reveals problems in vesicle fusion: number of fusion events per cell (j), single spike amplitude (k) and charge (l) were significantly decreased in endophilin TKO cells, while the kinetics of single fusion events, such as duration at half-maximal amplitude (m), rise time (n), and decay time (o), was unchanged. The stability of the fusion pore was also altered, as shown by shorter foot amplitude (p) while the foot duration (q) was not changed. TKO: 2 mice (16 cells), TKO + endophilin: 2 mice (12 cells)—each cell is a biological replicate. Error bars denote SEM. N = number of independent replicates. Unpaired two-sided t-test. *p < 0.05, **p < 0.01, ***p < 0.001, ns not significant.
Fig. 3
Fig. 3. Number, distribution, and size of LDCVs were not altered in endophilin TKO chromaffin cells in culture.
a Typical electron micrographs of WT, endophilin KWK (littermate control) and endophilin TKO chromaffin cells in dissociated culture. Bottom row shows the sub-plasma membrane area at higher magnification. Scale bar: 1 µm (top row) and 0.5 µm (bottom row). b Total number of vesicles/cell cross section, c surface of the vesicle projection, d number of docked vesicles/cell cross section and e the average distance of vesicles to the plasma membrane in dissociated chromaffin cell cultures. Bar shows mean, error bars SEM, dots are individual measurements. f Relative cumulative distribution of vesicles to the plasma membrane in 5 nm bins. Insert shows the distribution profile in the first 100 nm, line shows average, ribbon shows SEM (Kolmogorov–Smirnov test with Bonferroni-correction). af Three independent experiments, four mice each, cells WT (43), KOWTKO (34), and TKO (32). One-way ANOVA after Tukey’s post-hoc test, ns not significant.
Fig. 4
Fig. 4. Exocytic machinery is unaltered in the chromaffin cells without endophilin.
a, b Confocal images of endophilin TKO and control (WT and littermate endophilin KOWTKO) chromaffin cells stained for chromogranin-A (CgA; LDCV marker) revealed no difference in the number of CgA-positive vesicles measured in the whole volume of the cell (N = 4, WT 5 mice (54 cells), KOWTKO 4 mice (42 cells), and TKO 5 mice (57 cells), p-value = 0.96, one-way ANOVA with Tukey’s multiple comparison). An optical section through the equatorial plane of the cells is shown in a. Scale bar 3 µm. c Images of endophilin TKO, littermate KOWTKO and WT chromaffin cells stained with anti-synaptotagmin-1 (Syt-1) and CgA antibodies. Scale bar 3 µm. d Immunofluorescence levels revealed no change in synaptotagmin-1 levels (N = 4, WT 5 mice (48 cells) and TKO 5 mice (67cells), p-value = 0.45, unpaired two-sided t-test). e Quantification of the Syt-1 intensity on the CgA-positive vesicles revealed no significant difference between the genotypes (N = 4, WT 4 mice (39 cells) and TKO 3 mice (23 cells), p-value = 0.76, unpaired two-sided t-test). f Representative images of endophilin TKO and WT chromaffin cell stained for Munc18-1, SNARE proteins SNAP25 and VAMP2 and synaptotagmin-7. g Quantification of Munc18-1 (N = 3, WT 3 mice (24 cells) and TKO 3 mice (22 cells), p-value = 0.25), SNAP-25 (N = 3, WT 3 mice (32 cells) and TKO 3 mice (35 cells), p-value = 0.07), VAMP2 (N = 3, WT 4 mice (43 cells) and TKO 4 mice (43 cells), p-value = 0.27) and Syt7 (N = 3, WT 3 mice (44 cells) and TKO 3 mice (42 cells), p-value = 0.082) immunofluorescence showed no significant changes for any of these proteins. Error bars denote SEM. N = number of independent replicates. ns not significant.
Fig. 5
Fig. 5. Minor endocytic defects in the absence of endophilin in chromaffin cells.
a Immunofluorescence for clathrin heavy chain (HC), adaptor protein 2 (AP2) and dynamin-1 in WT and endophilin TKO cells. Scale bar 3 µm. Fluorescence quantification revealed small but significant increase in clathrin-HC intensity (N = 3, WT 3 mice (25 cells) and TKO 3 mice (24 cells), whereas intensities of AP2 (N = 3, WT 3 mice (20 cells) and TKO 3 mice (23 cells)) and dynamin-1 (N = 3, WT 3 mice (21 cells) and TKO 3 mice (21 cells)) were unaltered in endophilin TKO cells. b Protein levels of the main endocytic factors—clathrin, adaptor protein 180 (AP180) and dynamins 1–3 (inspected by western blotting) were not altered in adrenal gland homogenates. Below: Quantification from clathrin-HC (N = 3, 3 samples/genotype), AP180 (N = 3, 3 samples/genotype) and dynamin (N = 4, 4 samples/genotype)—note that each sample on the blot originates from 6 to 8 glands from 3 to 4 mice of the same genotype pooled together. c, d Transferrin (conjugated with Alexa Fluor-546) uptake in the endophilin TKO cells compared to the littermate control and WT (N = 3, 3 mice per genotype WT (41 cells), KOWTKO (40 cells), and TKO (55 cells); note that uptake was analyzed in the whole cell, no difference in uptake between WT and endophilin TKO cells was observed). Scale bar 3 µm. e, f mCLING-Atto647 uptake (example cells shown in Supplementary Movies 1, 3, and 4) by chromaffin cells of indicated genotypes showed no significant difference in the number of endocytosed vesicles (p-value = 0.44, N = 3, 3 mice per genotype: WT (44 cells), KOWTKO (56 cells), and TKO (42 cells)). Note that uptake was analyzed in only one cell plane, and the bright-field image was acquired before recording the mCLING fluorescent signals so the focal planes are not always identical. The specificity of mCLING-Atto647 uptake was tested in the stimulated cells in the presence of Pitstop-2 inhibitor (Supplementary Movie 2 and Suppl. Fig. 5b). Error bars denote SEM. N number of independent replicates. One-way ANOVA after Tukey’s post-hoc test, *p < 0.05, **p < 0.01, ns not significant.
Fig. 6
Fig. 6. Endophilin BAR-domains are not sufficient to mediate chromaffin cell exocytosis.
a Schematic depicting the domain structure of endophilin 2 and two mutants lacking the SH3 domain expressed in the subsequent experiments. b Exocytosis induced by calcium uncaging in endophilin TKO chromaffin cells (red traces) compared to TKO cells expressing either endophilin 1 BAR domain (yellow traces), endophilin 2-BAR domain (green traces) or full-length endophilin 2 WT protein (gray traces). Panel arranged as in Fig. 1i, top: intracellular calcium level increase induced by flash photolysis at 0.5 s (at arrow). The inset shows the pre-flash calcium levels. Middle: averaged traces of membrane capacitance upon Ca2+-induced exocytosis. Bottom: mean amperometric current (left axis) and cumulative charge (right axis). ce Quantification of changes in capacitance revealed a further reduction in different phases of release (burst and sustained) in TKO cells expressing endophilin 1-BAR or endophilin 2-BAR domain. Gray line indicates the mean of TKO cells expressing endophilin 2 full-length protein and the shaded area indicates the SEM. be N = 3, 3 mice/condition, cells TKO (16), TKO + endophilin1 BAR (17) and TKO + endophilin 2-BAR (17). Error bars denote SEM. N = number of independent replicates. One-way ANOVA with Tukey’s multiple comparison test, *p < 0.05, **p < 0.01.
Fig. 7
Fig. 7. Endophilin’s role in exocytosis is mediated, at least in part, through its interaction with intersectin-1.
ad Distribution of ITSN-1 and ITSN-2 was altered in the endophilin TKO cells. Representative confocal images of chromaffin cells stained for ITSN-1 (a) and ITSN-2 (c) under resting and stimulated (depolarization by high K+) conditions (note that different cells are shown for each condition in the panel). Intensity line profiles below indicate ITSN-1 and ITSN-2 intensities along the line (the approx. line position is marked in yellow in a and c). Quantification of ITSN-1 (b) and ITSN-2 (d) intensities in the cytosol vs. near the membrane (see Methods and Suppl. Fig. 7) revealed an altered distribution of ITSN-1 and ITSN-2 in endophilin TKO cells that did not further change upon stimulation. ITSN-1 (N = 3, 3 mice each, WT resting (26 cells), TKO resting (33 cells), WT high K (32 cells) and TKO high K (36 cells), and ITSN2 (N = 3, 3 mice/condition, WT resting (29 cells), TKO resting (30 cells), WT high K (30 cells) and TKO high K (28 cells). b, d note that WT resting vs. WT high K+, WT resting vs. TKO resting and TKO resting vs. TKO high K+ were compared). e, f The altered distribution of ITSN-1 in endophilin TKO cells was rescued by expression of endophilin 1 (green traces), but not by expression of endophilin 1-ΔITSN (endophilin E329K + S336K mutant that does not bind ITSN-1) (pink traces). N = 3, 3 mice, TKO (25 cells), TKO + A1FL (30 cells) and TKO + A1 ΔITSN (35 cells). gm Expression of endophilin 1  in endophilin TKO cells rescued exocytosis as inspected by combined capacitance and amperometry measurements (see Fig. 2), but the same effect could not be achieved by expressing an endophilin mutant that does not bind ITSN1 (E329K + S336K). Data shown in gm are from four independent experiments, four mice each condition, cells TKO (39), TKO + A1-FL (36), and TKO + A1 ΔITSN (21). Scale bars 3 µm. Error bars denote SEM. N = number of independent replicates. One-way ANOVA with Tukey’s post-hoc test, *p < 0.05, **p < 0.01; ***p < 0.001, ns not significant.
Fig. 8
Fig. 8. Intersectin’s role in exocytosis is mediated through its interaction with endophilin.
a Pull-down experiment revealed an interaction between the SH3 domains of endophilin 1 and ITSN-1 that was perturbed when recombinant ITSN-1 with two-point mutations (W949 + Y965E) was used. Representative blot (three independent experiments were performed). b Exocytosis measured in ITSN1 KO cells (black traces) and ITSN1 KO cells expressing full-length proteins ITSN1 WT (orange traces) or ITSN1Δendo (W949 + Y965E in the SH3 domain, indicated in the schematic) (green traces). Panels are arranged similar to Fig. 1i. Note that ITSN1 KO cells expressing ITSN1 W949 + Y965E did not on average differ from ITSN1 KO cells (except for the sustained release), while expression of full-length ITSN1 WT was significantly higher. cg Exponential fitting analysis revealed that burst (c), as well as the vesicle pool sizes (e), and kinetics (f, g), could be rescued by expression of ITSN1 WT, but no ITSN1 W949 + Y965E (sustained release could not be rescued). bg N = 3, 3 mice each, number of analyzed cells: ITSN1-KO (18 cells), ITSN1-KO + ITSN-FL (19 cells), and ITSN1-KO + ITSN-Δendo (18 cells). Error bars denote SEM. N = number of independent replicates. One-way ANOVA with Tukey’s post-hoc test *p < 0.05; **p < 0.01; ***p < 0.001, ns not significant.

References

    1. Wu L-G, Hamid E, Shin W, Chiang H-C. Exocytosis and endocytosis: modes, functions, and coupling mechanisms. Annu. Rev. Physiol. 2014;76:301–331. doi: 10.1146/annurev-physiol-021113-170305. - DOI - PMC - PubMed
    1. Maritzen T, Haucke V. Coupling of exocytosis and endocytosis at the presynaptic active zone. Neurosci. Res. 2018;127:45–52. doi: 10.1016/j.neures.2017.09.013. - DOI - PubMed
    1. Chanaday NL, Cousin MA, Milosevic I, Watanabe S, Morgan JR. The synaptic vesicle cycle revisited: new insights into the modes and mechanisms. J. Neurosci. 2019;39:8209–8216. doi: 10.1523/JNEUROSCI.1158-19.2019. - DOI - PMC - PubMed
    1. Ringstad N, Nemoto Y, Camilli PD. The SH3p4/Sh3p8/SH3p13 protein family: Binding partners for synaptojanin and dynamin via a Grb2-like Src homology 3 domain. Proc. Natl Acad. Sci. 1997;94:8569–8574. doi: 10.1073/pnas.94.16.8569. - DOI - PMC - PubMed
    1. Heuvel Ede, et al. Identification of the major synaptojanin-binding proteins in brain. J. Biol. Chem. 1997;272:8710–8716. doi: 10.1074/jbc.272.13.8710. - DOI - PubMed

Publication types

Substances