. 2020 Mar 9;10(1):4277.
doi: 10.1038/s41598-020-61142-8.

APOE4 is Associated with Differential Regional Vulnerability to Bioenergetic Deficits in Aged APOE Mice

Affiliations

APOE4 is Associated with Differential Regional Vulnerability to Bioenergetic Deficits in Aged APOE Mice

Estela Area-Gomez et al. Sci Rep. .

Abstract

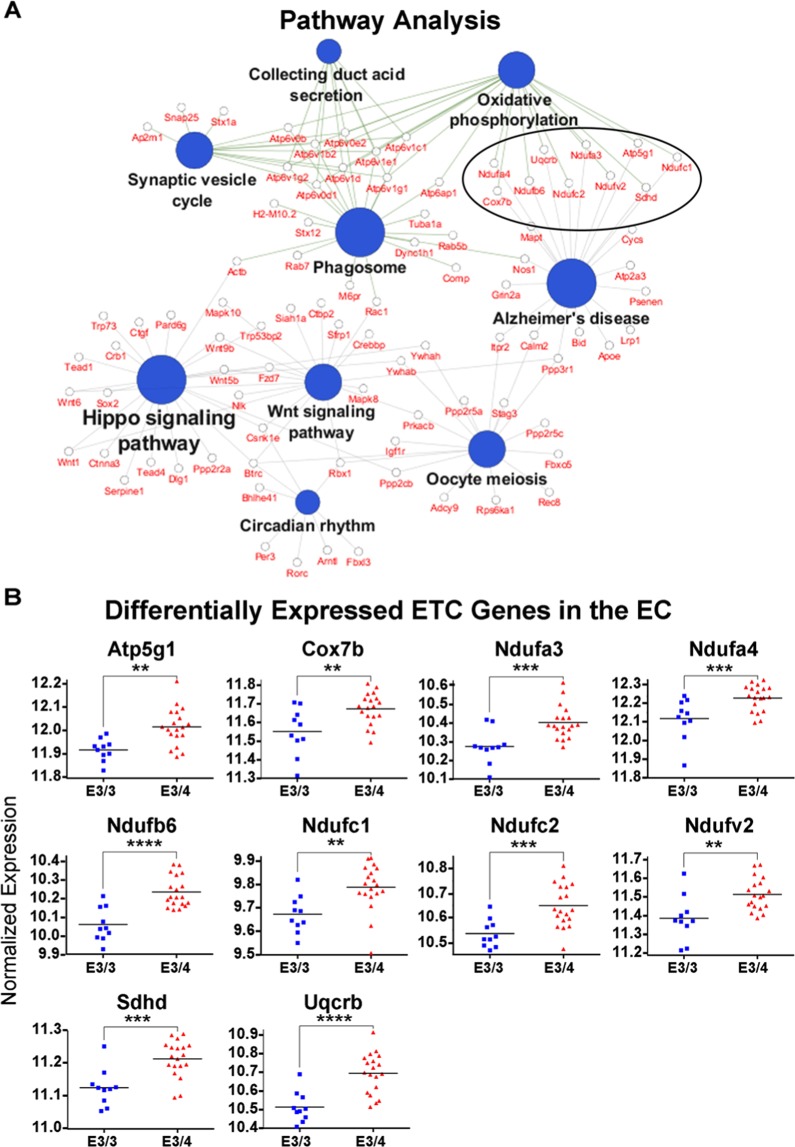
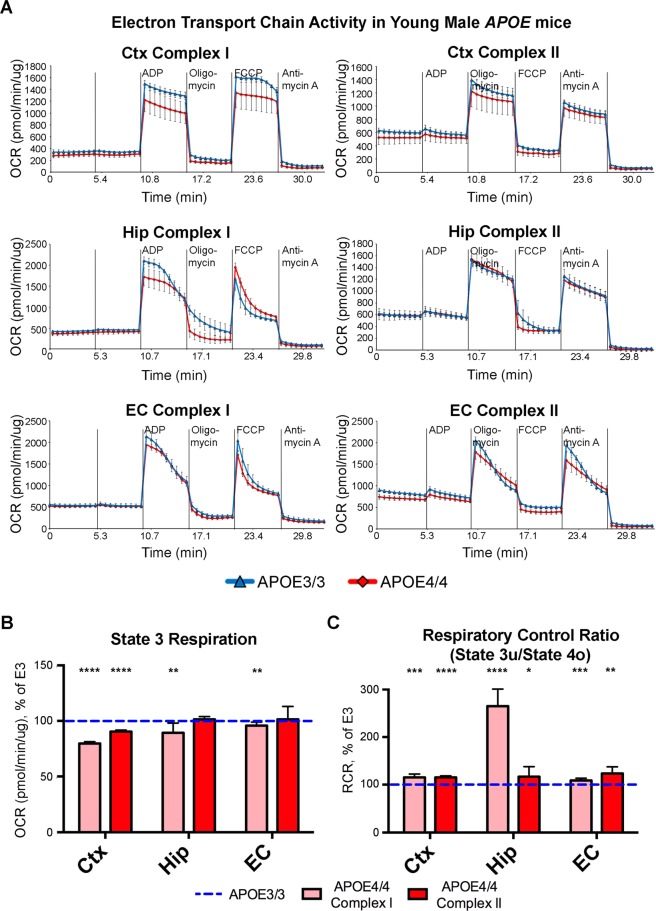
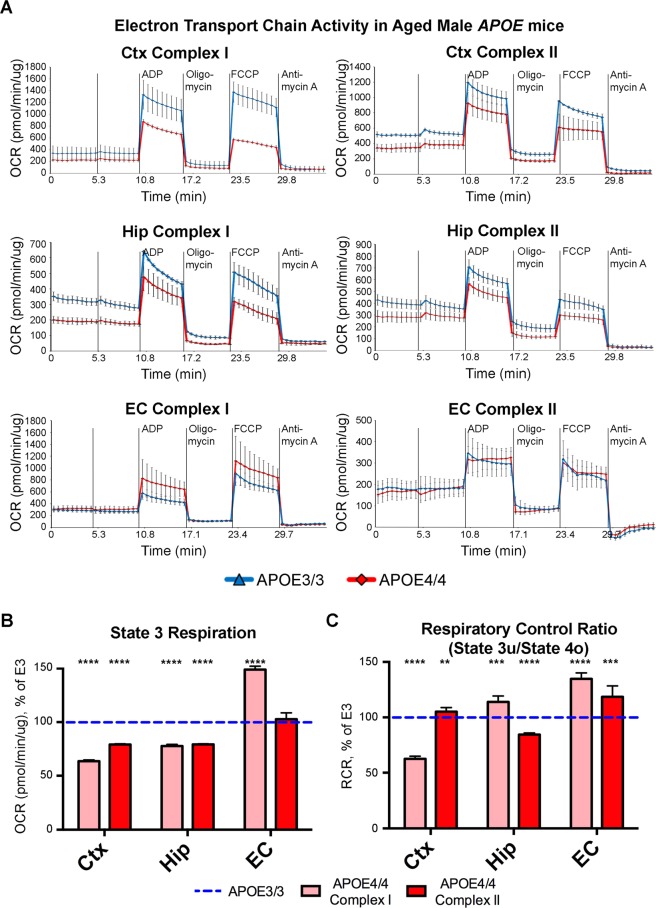
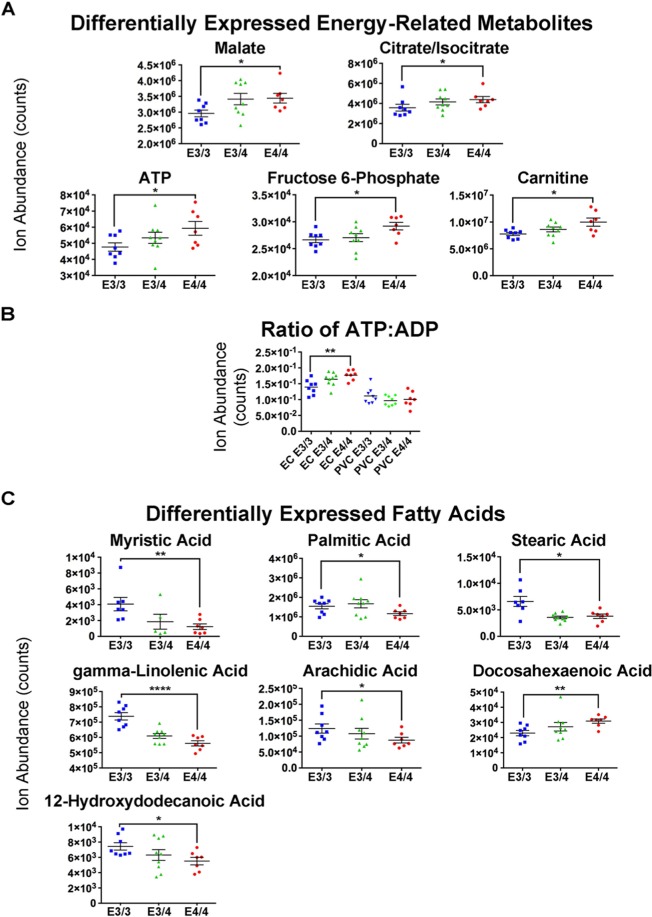
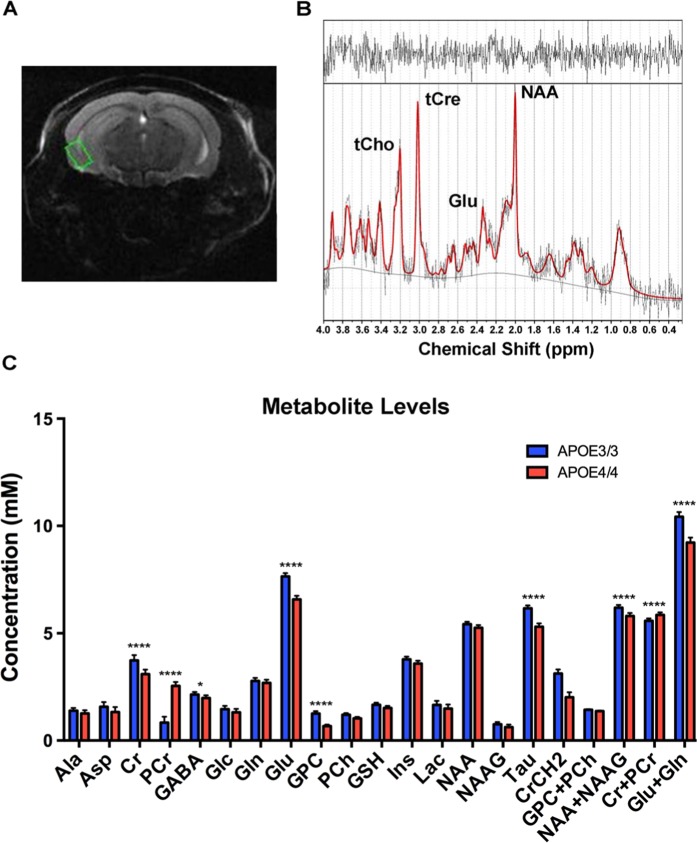
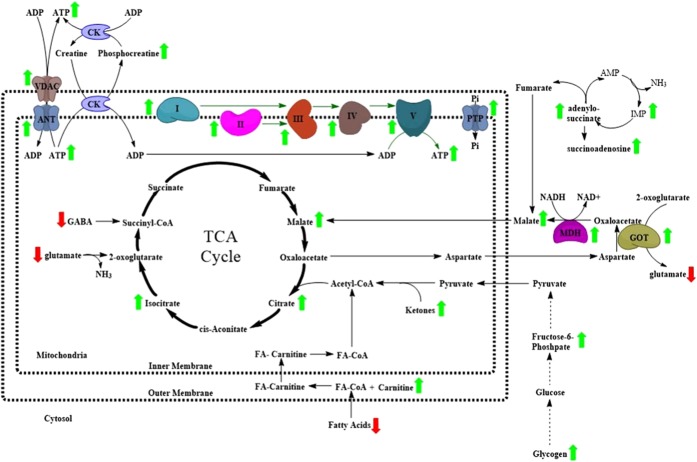
The ε4 allele of apolipoprotein E (APOE) is the dominant genetic risk factor for late-onset Alzheimer's disease (AD). However, the reason for the association between APOE4 and AD remains unclear. While much of the research has focused on the ability of the apoE4 protein to increase the aggregation and decrease the clearance of Aβ, there is also an abundance of data showing that APOE4 negatively impacts many additional processes in the brain, including bioenergetics. In order to gain a more comprehensive understanding of APOE4's role in AD pathogenesis, we performed a transcriptomics analysis of APOE4 vs. APOE3 expression in the entorhinal cortex (EC) and primary visual cortex (PVC) of aged APOE mice. This study revealed EC-specific upregulation of genes related to oxidative phosphorylation (OxPhos). Follow-up analysis utilizing the Seahorse platform showed decreased mitochondrial respiration with age in the hippocampus and cortex of APOE4 vs. APOE3 mice, but not in the EC of these mice. Additional studies, as well as the original transcriptomics data, suggest that multiple bioenergetic pathways are differentially regulated by APOE4 expression in the EC of aged APOE mice in order to increase the mitochondrial coupling efficiency in this region. Given the importance of the EC as one of the first regions to be affected by AD pathology in humans, the observation that the EC is susceptible to differential bioenergetic regulation in response to a metabolic stressor such as APOE4 may point to a causative factor in the pathogenesis of AD.


Conflict of interest statement

K.E.D is on the board of directors of Ceracuity LLC. The authors declare no competing interests.

Figures

Figure 1
Figure 1
Transcriptomics analysis reveals an upregulation of electron transport chain genes in the EC of aged male APOE4 mice. RNA-sequencing was performed in order to analyze the effects of differential APOE isoform expression on RNA levels in the EC and PVC of aged APOE mice (19 APOE3/4 males vs. 10 APOE3/3 males). (A) Shown here are the significantly enriched KEGG pathways observed in the EC of APOE3/4 vs. APOE3/3 mice, using Cytoscape’s ClueGo application, with the ten differentially expressed electron transport chain (ETC) genes circled. (B) Graphs of the differentially regulated ETC genes in the EC of the APOE3/4 vs. APOE3/3 mice. (**denotes p < 0.01; ***denotes p < 0.001; ****denotes p < 0.0001).
Figure 2
Figure 2
Seahorse analysis reveals minimal differences in mitochondrial respiration in the cortex, hippocampus, and EC of young male APOE4 mice. Seahorse analysis was performed in order to analyze the effects of differential APOE isoform expression on mitochondrial respiration in mitochondria that were isolated from the cortex (Ctx), hippocampus (Hip) and EC of 6-month-old APOE mice (3 APOE4/4 males, tissues pooled vs. 3 APOE3/3 males, tissues pooled). (A) The oxygen consumption rate (OCR) from each region shows minor reductions in Complex I-mediated mitochondrial respiration in the Ctx, but not in Complex II-mediated mitochondrial respiration in the Ctx or in Complex I- or Complex II-mediated mitochondrial respiration in the Hip and EC of the young APOE4/4 mice. (B,C) Bar graphs showing the average OCR from (B) State 3 and for (C) the Respiration Control Ratio (RCR; state 3 u/state 4o) in each region of the APOE4/4 mice, as a percentage of the APOE3/3 OCR from the equivalent tissues. The dotted blue line represents the normalized levels in the APOE3/3 tissues. (*denotes p < 0.05; **denotes p < 0.01; ***denotes p < 0.001; ****denotes p < 0.0001).
Figure 3
Figure 3
Seahorse analysis reveals decreased mitochondrial respiration in the cortex and hippocampus, but not in the EC, of aged male APOE4 mice. Seahorse analysis was performed in order to analyze the effects of differential APOE isoform expression on mitochondrial respiration in mitochondria that were isolated from the cortex (Ctx), hippocampus (Hip) and EC of 20-month-old APOE mice (2 APOE4/4 males, tissues pooled vs. 2 APOE3/3 males, tissues pooled). (A) The oxygen consumption rate (OCR) from each region shows decreased mitochondrial respiration in the Ctx and Hip, but not the EC of the aged APOE4/4 mice. (B,C) Bar graphs showing the average OCR from (B) State 3 and for (C) the Respiration Control Ratio (RCR; state 3 u/state 4o) in each region of the APOE4/4 mice, as a percentage of the APOE3/3 OCR from the equivalent tissues. The dotted blue line represents the normalized levels in the APOE3/3 tissues. (**denotes p < 0.01; ***denotes p < 0.001; ****denotes p < 0.0001).
Figure 4
Figure 4
Metabolomics analysis reveals differential levels of energy-related metabolites and fatty acids in the EC of aged male APOE4 mice. An untargeted metabolomics analysis was performed in order to analyze the effects of differential APOE isoform expression on metabolite levels in the EC and PVC of aged APOE mice (8 APOE3/3, 9 APOE3/4 and 7 APOE4/4 males). (AC) Shown here are graphs of the bioenergetics-related metabolites that were shown to be differentially expressed in the EC of the APOE4/4 vs. APOE3/3 mice: (A) general energy-related metabolites, (B) the ratio of ATP:ADP in each genotype group from the EC and PVC of the aged APOE mice, and (C) fatty acids. (*denotes p < 0.05; **denotes p < 0.01; ****denotes p < 0.0001).
Figure 5
Figure 5
Proton nuclear magnetic resonance spectroscopy reveals differential expression of phosphocreatine, glutamate and GABA in the EC of aged male APOE4 mice. 1H NMR spectroscopy was performed in order to analyze the effects of differential APOE isoform expression on the levels of high-abundance metabolites in the EC of anesthetized APOE mice (7 APOE4/4 males vs. 7 APOE3/3 males). (A) A representative coronal anatomical image used in the analysis, with the volume of interest, highlighted in green, shown over the EC. (B) A typical spectrum from the EC showing the spectral position of some major metabolites: N-Acetylaspartic acid (NAA), glutamate (Glu), total creatine (tCr) and total choline (tCho). The raw spectrum is shown in black (with no smoothing), and the software fit of the model spectra is shown in red. The top of the figure shows the difference between the raw spectrum and the fit, with a “good fit” showing random oscillations with little noise. The solid black line at the bottom of the figure is the baseline. (C) The metabolite concentrations in the EC of aged APOE3/3 and APOE4/4 mice. The metabolites reported are: alanine (Ala), aspartate (Asp), creatine (Cr), phosphocreatine (PCr), gamma-aminobutyric acid (GABA), glucose (Glc), glutamine (Gln), glutamate (Glu), glycerophosphocholine (GPC), phosphocholine (PCh), glutathione (GSH), myo-inositol (Ins), lactate (Lac), N-Acetylaspartate (NAA), N-Acetylaspartateglutamate (NAAG), taurine (Tau), total choline (GPC and PCh), total NAA (NAA and NAAG), total creatine (Cr and PCr) and total glutamate and glutamine (Glu and Gln). (* denotes p < 0.05; ****denotes p < 0.0001).
Figure 6
Figure 6
Identification of differentially expressed bioenergetic genes and metabolites in the EC of aged APOE4 mice. A schematic of the bioenergetics genes and metabolites that have been predicted to be altered by differential APOE isoform expression in this study, as depicted in a simplified manner with respect to their relationships to each other and their location inside or outside of mitochondria. Genes or metabolites that were putatively identified as increased in aged male APOE4 mice, as compared to aged male APOE3 mice, are marked with a green arrow, and those that are decreased are marked with a red arrow.

References

    1. Mahley RW, Rall SC., Jr. Apolipoprotein E: far more than a lipid transport protein. Annu. Rev. Genomics Hum. Genet. 2000;1:507–537. doi: 10.1146/annurev.genom.1.1.507. - DOI - PubMed
    1. Han X. The role of apolipoprotein E in lipid metabolism in the central nervous system. Cell Mol. Life Sci. 2004;61:1896–1906. doi: 10.1007/s00018-004-4009-z. - DOI - PMC - PubMed
    1. Holtzman DM, Herz J, Bu G. Apolipoprotein E and apolipoprotein E receptors: normal biology and roles in Alzheimer disease. Cold Spring Harb. Perspect. Med. 2012;2:a006312. - PMC - PubMed
    1. Liu CC, Kanekiyo T, Xu H, Bu G. Apolipoprotein E and Alzheimer disease: risk, mechanisms and therapy. Nat. Rev. Neurol. 2013;9:106–118. doi: 10.1038/nrneurol.2012.263. - DOI - PMC - PubMed
    1. Farrer LA, et al. Effects of age, sex, and ethnicity on the association between apolipoprotein E genotype and Alzheimer disease. A meta-analysis. APOE and Alzheimer Disease Meta Analysis Consortium. JAMA. 1997;278:1349–1356. doi: 10.1001/jama.1997.03550160069041. - DOI - PubMed

Publication types

Substances