. 2020 Apr;122(9):1298-1308.
doi: 10.1038/s41416-020-0777-y. Epub 2020 Mar 10.

Lactic acidosis induces resistance to the pan-Akt inhibitor uprosertib in colon cancer cells

Affiliations

Lactic acidosis induces resistance to the pan-Akt inhibitor uprosertib in colon cancer cells

Emily M E Barnes et al. Br J Cancer. 2020 Apr.

Abstract

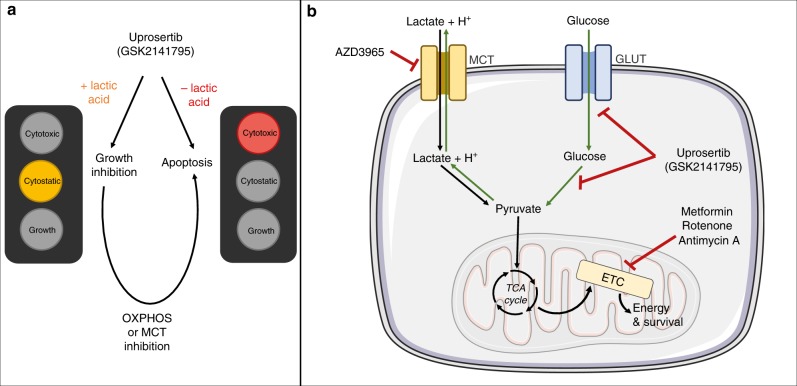
Background: Akt signalling regulates glycolysis and drives the Warburg effect in cancer, thus decreased glucose utilisation is a pharmacodynamic marker of Akt inhibition. However, cancer cells can utilise alternative nutrients to glucose for energy such as lactate, which is often elevated in tumours together with increased acidity. We therefore hypothesised that lactic acidosis may confer resistance to Akt inhibition.

Methods: The effect of the pan-Akt inhibitor uprosertib (GSK2141795), on HCT116 and LS174T colon cancer cells was evaluated in the presence and absence of lactic acid in vitro. Expression of downstream Akt signalling proteins was determined using a phosphokinase array and immunoblotting. Metabolism was assessed using 1H nuclear magnetic resonance spectroscopy, stable isotope labelling and gas chromatography-mass spectrometry.

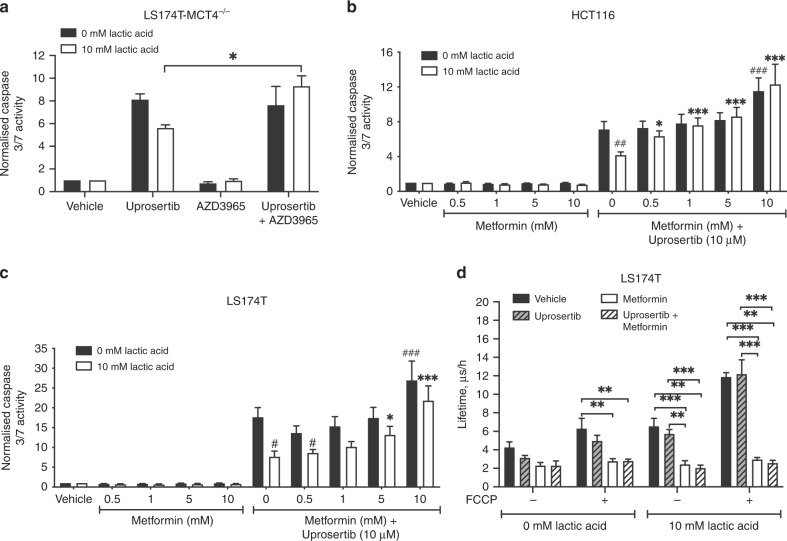
Results: Lactic acid-induced resistance to uprosertib was characterised by increased cell survival and reduced apoptosis. Uprosertib treatment reduced Akt signalling and glucose uptake irrespective of lactic acid supplementation. However, incorporation of lactate carbon and enhanced respiration was maintained in the presence of uprosertib and lactic acid. Inhibiting lactate transport or oxidative phosphorylation was sufficient to potentiate apoptosis in the presence of uprosertib.

Conclusions: Lactic acidosis confers resistance to uprosertib, which can be reversed by inhibiting lactate transport or oxidative metabolism.


Conflict of interest statement

The authors declare no competing interests.

Figures

Fig. 1
Fig. 1. Lactic acid induces resistance to the pan-Akt inhibitor uprosertib in colon cancer cells.
a, b Effects of uprosertib on survival in the presence or absence lactic acid. HCT116 and LS174T cell lines were treated for 72 h with uprosertib (1 μM to 15 μM) in the presence or absence of lactic acid (0–20 mM) and biomass was determined using SRB assays (a). LS174T cells were treated with uprosertib (10 μM) for 72 h before cells were counted (b). DMSO (0.1%) was used as a vehicle control. The results shown are normalised to the relative 0 h controls. c The effect of uprosertib on apoptosis in the presence or absence of lactic acid. Cells were treated for 24 h with uprosertib (5 or 10 μM) in the presence or absence of lactic acid (10 or 20 mM) and apoptosis was measured using a Caspase-Glo 3/7 assay (c). Results are shown as caspase 3/7 induction relative to cell biomass measured using SRB and the relevant vehicle controls. d The effect of uprosertib treatment (5, 10 and 15 μM) on ATP levels in the presence or absence of lactic acid in LS174T cells. Results are shown as ATP levels normalised to cell biomass measured using SRB and to the relevant vehicle controls. e Effect of uprosertib treatment and lactic acid on 3-D spheroids. HCT116 spheroids were dosed with uprosertib (1–15 μM) in the presence or absence of lactic acid (10 mM) for 72 h. Spheroid viability was quantified using a CellTitre-Glo 3-D assay and representative images of spheroids from one independent experiment are shown (e). The scale bar represents 100 μm. Quantified results are shown as fold change in ATP normalised to the relevant vehicle control. The dotted line at y = 1 in b indicates the initial 0 h cell number. The results shown are the mean ± SEM from three independent experiments (n = 3). *p < 0.05, **p < 0.01 and ***p < 0.001.
Fig. 2
Fig. 2. Uprosertib inhibits Akt signalling in the presence and absence of lactic acid.
ac Effect of uprosertib treatment in the presence or absence of lactic acid on Akt signalling. The proteome profiler human phosphokinase array kit was used to investigate the phosphorylation of downstream Akt signalling proteins in LS174T cells dosed with uprosertib (10 μM) for 1 h in the presence or absence of lactic acid (10 mM) (a). DMSO (0.1%) was used as a vehicle control. Densitometry using Image-J was done to quantify the expression of relevant phosphoproteins and results are shown as the Log2 of the fold change in phosphorylation compared to the 0 mM lactic acid vehicle controls (mean of technical duplicates) (b). Numbers on the array correspond to the numbered protein in the graph. Phosphorylation and total Akt and PRAS40 expression were examined using western blotting in LS174T cells after 1 h of uprosertib treatment (10 μM) in the presence or absence of lactic acid (10 mM) (c). β-actin was used as a loading control. Blots shown are from one representative experiment from a minimum of three independent replicates. Densitometry was performed to quantify expression of phospho-Akt and phospho-PRAS40. Data were normalised to the relevant total protein and graphs were plotted as fold change relative to the 0 mM lactic acid vehicle control. Data were presented as mean ± SEM from three independent replicates (n = 3). *p < 0.05.
Fig. 3
Fig. 3. Uprosertib inhibits glucose utilisation in the presence and absence of lactic acid.
a, b Effect of uprosertib and lactic acid on glucose uptake and lactate release rates. LS174T and HCT116 cells were treated with uprosertib (10 μM) in the presence or absence of lactic acid (10 mM) for 24 h before media were collected and cells counted. Extracellular glucose and lactate concentrations were determined using NMR spectroscopy and the rate of glucose uptake (a) or lactate release (b) in fmol/ cell/ hour was calculated. c Schematic representation of enrichment of 13C derived from 13C6-glucose into glycolytic and TCA cycle intermediates. d, e Effect of uprosertib treatment in the presence or absence of lactic acid on glucose utilisation in HCT116 (d) and LS174T (e) cells. Fraction labelled from 13C6-glucose into pyruvate (M + 3), lactate (M + 3) and citrate (M + 2) in the presence or absence of lactic acid (10 mM) after 4 h of treatment with uprosertib (10 μM). The results shown are the mean ± SEM from three independent experiments (n = 3). *p < 0.05, **p < 0.01 and ***p < 0.001.
Fig. 4
Fig. 4. Enrichment of 13C3-lactic acid into cells is maintained in the presence of uprosertib.
a Schematic representation of 13C3-lactic acid enrichment into pyruvate and TCA cycle intermediates. b, c Mass isotopologue distributions of 13C3-lactic acid enrichment into pyruvate (b) and citrate (c) after 4 h of incubation in the presence of uprosertib (10 μM) in LS174T and HCT116 cell lines. Cells were incubated in 10 mM of 13C3-lactic acid. DMSO (0.1%) was used for vehicle controls. The results shown are the mean ± SEM from three independent experiments (n = 3). *p < 0.05, **p < 0.01 and ***p < 0.001.
Fig. 5
Fig. 5. Targeting lactate transport and oxidative metabolism re-sensitises cells to uprosertib in the presence of lactic acid.
a MCT1 inhibition using AZD3965 in combination with uprosertib in LS174T-MCT4−/− cells. LS174T-MCT4−/− cells were treated with uprosertib (10 μM) in combination with AZD3965 (1 μM) for 24 h (a). Apoptosis was measured using the Caspase-Glo 3/7 assay. Results were normalised to cell density measured using SRB assays and also to the vehicle controls. The results shown are the mean ± SEM from five independent experiments (n = 5). b, c The effect of combining metformin with uprosertib on apoptosis. HCT116 (b) and LS174T (c) cell lines were dosed with metformin (0.5 mM to 10 mM) alone or in combination with uprosertib (10 μM) for 24 h before apoptosis was measured using a Caspase-Glo 3/7 assay. Results are shown as caspase 3/7 induction relative to cell biomass measured using SRB and also to the relevant vehicle controls. d The effect of metformin and uprosertib treatment on the OCR in the presence and absence of lactic acid. LS174T cells were treated with metformin and uprosertib in the presence and absence of lactic acid for 2 h (d). FCCP was used as a positive control to measure the maximum respiratory capacity. The MitoXpress Xtra reagent was added to wells before fluorescence was measured over 2 h. The OCR was calculated from the slope of the fluorescent lifetime calculated using MARS analysis software. Graphs were plotted as OCR (lifetime, μs/h). The results shown are the mean ± SEM from four independent experiments (n = 4). In a, d statistical significance is indicated by a line with *p < 0.05, **p < 0.01 or ***p < 0.001. In b, c statistical significance compared to the 0 mM lactic acid uprosertib only condition is denoted as #p < 0.05, ##p < 0.01 or ###p < 0.001 and compared to the 10 mM lactic acid uprosertib only condition is denoted as *p < 0.05 or ***p < 0.001.
Fig. 6
Fig. 6. Schematic representation of the impact of uprosertib treatment combined with OXPHOS or MCT inhibition in cancer cells exposed to lactic acidosis.
a Alteration of cellular fate in the presence or absence of lactic acid. b Schematic of the possible metabolic effects associated with altered response to treatment. Exogenous lactic acid decouples glycolysis from OXPHOS as lactate (black arrows) is preferentially utilised via the TCA cycle over glucose (green arrows). ETC electron transport chain. This figure was produced and adapted using Servier Medical Art licensed under the Creative Commons Attribution 3.0 Unported License (https://www.servier.com).

References

    1. Vander Heiden MG, Cantley LC, Thompson CB. Understanding the Warburg effect: the metabolic requirements of cell proliferation. Science. 2009;324:1029–1033. - PMC - PubMed
    1. Hensley CT, Faubert B, Yuan Q, Lev-Cohain N, Jin E, Kim J, et al. Metabolic heterogeneity in human lung tumors. Cell. 2016;164:681–694. - PMC - PubMed
    1. Sonveaux P, Végran F, Schroeder T, Wergin MC, Verrax J, Rabbani ZN, et al. Targeting lactate-fueled respiration selectively kills hypoxic tumor cells in mice. J. Clin. Invest. 2008;118:3930–3942. - PMC - PubMed
    1. Hirayama A, Kami K, Sugimoto M, Sugawara M, Toki N, Onozuka H, et al. Quantitative metabolome profiling of colon and stomach cancer microenvironment by capillary electrophoresis time-of-flight mass spectrometry. Cancer Res. 2009;69:4918–4925. - PubMed
    1. Boroughs LK, DeBerardinis RJ. Metabolic pathways promoting cancer cell survival and growth. Nat. Cell Biol. 2015;17:351–359. - PMC - PubMed

Publication types

MeSH terms

LinkOut - more resources