. 2020 Apr;21(4):455-463.
doi: 10.1038/s41590-020-0623-7. Epub 2020 Mar 9.

The MHC-II peptidome of pancreatic islets identifies key features of autoimmune peptides

Affiliations

The MHC-II peptidome of pancreatic islets identifies key features of autoimmune peptides

Xiaoxiao Wan et al. Nat Immunol. 2020 Apr.

Erratum in

Abstract

The nature of autoantigens that trigger autoimmune diseases has been much discussed, but direct biochemical identification is lacking for most. Addressing this question demands unbiased examination of the self-peptides displayed by a defined autoimmune major histocompatibility complex class II (MHC-II) molecule. Here, we examined the immunopeptidome of the pancreatic islets in non-obese diabetic mice, which spontaneously develop autoimmune diabetes based on the I-Ag7 variant of MHC-II. The relevant peptides that induced pathogenic CD4+ T cells at the initiation of diabetes derived from proinsulin. These peptides were also found in the MHC-II peptidome of the pancreatic lymph nodes and spleen. The proinsulin-derived peptides followed a trajectory from their generation and exocytosis in β cells to uptake and presentation in islets and peripheral sites. Such a pathway generated conventional epitopes but also resulted in the presentation of post-translationally modified peptides, including deamidated sequences. These analyses reveal the key features of a restricted component in the self-MHC-II peptidome that caused autoreactivity.


Conflict of interest statement

Competing interests

The authors declare no competing interests.

Figures

Extended Data Fig. 1
Extended Data Fig. 1. Assessing the MHCII peptidomes of the pancreatic islets, pancreatic lymph nodes and spleens from NOD mice.
a, Representative FACS plots showing the APC populations in the islets from 8–10-week old female NOD mice. The major APCs in the islet were the islet macrophages (CD45+CD11c+F4/80+) and dendritic cells (CD45+CD11c+F4/80), along with a minor population of B cells (CD45+CD11cF4/80B220+). Data are representative of n = 4 independent experiment including n = 6 mice per experiment. b, Workflow for isolating the MHCII peptidome followed by mass spectrometry and immunological analyses. c, The lengths of all the peptides identified in the MHCII peptidomes from the indicated sites. Most of the peptides were 14–17 residues long, and a small number was longer than 25 residues. Data (mean) are from the mass spectrometry analysis of the MHCII peptidomes depicted in Supplementary Tables 1–3. d, Antigen presentation assay showing responses of an Ins1C-specific CD4+ T cell hybridoma to C3g7 APCs treated with or without chloroquine and pulsed with the full-length 29-residue Ins1C:33–61. The assay measures IL-2 production by the CD4+ T cell hybridoma during stimulation with the cognate antigen, assessed by the proliferation (3H incorporation) of the IL-2-depedent cell line CTLL-2 (see Methods). The Data (mean ± s.e.m.) are representative of n = 2 independent experiments with similar results.
Extended Data Fig. 2
Extended Data Fig. 2. Evaluation of T cell reactivity and relative MHCII binding affinity in peptides selected from the MHCII peptidome.
a, Pooled islet and pLN cells from 8–10-week old female NOD mice were challenged with each indicated peptide for two cycles, and ELISPOT assays were conducted to read IFN-γ production in the cells upon recalling with the same peptide (see Methods). The results show positive T cell responses to two immunogenic β-cell-derived peptides, Ins1C:33–61 and InsB:9–23, indicating the presence of the effector T cells to these peptides. No IFN-γ responses were observed to the HEL protein or the I-Ag7-binding HEL:11–25 peptide, demonstrating that the culture assay did not generate de novo T cells. Data (mean ± s.e.m.) are representative of n = 3 experiments using n = 5 mice per experiment. b, Different numbers of pre-activated HEL-reactive T cells were spiked into the normal two-cycle culture, followed by recall with the HEL peptide and ELISPOT assay. The data depict a ~1:1 recovery ratio of the spiked HEL-reactive T cells with the IL-2 spots. The assay detected as few as ~20 pre-activated HEL-reactive T cells, indicating a high sensitivity. Data (mean ± s.e.m.) are representative of n = 2 experiments using n = 8 mice per experiment. c, An example of the competitive binding assay and the presentation of the data. A standard APC line (C3g7) was cultured with 1 μM HEL:11–25 peptide together with serial dilutions of a competitor peptide: the response of a specific T cell hybridoma to HEL:11–25 was probed by standard antigen presentation assay (see Methods). In every experiment, each competitor peptides were compared to a reference peptide, g7-MIME, with known strong binding to I-Ag7. The amounts of the peptide required to compete half-maximal T cell response to HEL:11–25 (IC50) was estimated and compared to the reference peptide. A higher amount indicated a weaker binding affinity. The table (right) depicts the IC50 calculated from several representative peptides. The results are presented as the percent of reference after normalization to the reference g7-MIME peptide. Data are presentative of n = 4 independent experiments with similar results.
Extended Data Fig. 3
Extended Data Fig. 3. CD4+ T cell recognition of the InsB:15–23 register is influenced by the nature of the flanking residues.
a, Predicted I-Ag7-binding registers included in the InsB:11–25 peptide. A preferred binding register is indicated by a log of odds (LOD) score (see Methods). b, c, An InsB:11–25-specific T cell clone (clone 58) was examined for its responses to C3g7 APCs pulsed with peptides containing the InsB:15–23 binding core with varied flanking residues (grey shaded). b, Clone 58 also reacted with the InsB:12–26 peptide, an MHCII-bound sequence identified in the spleen peptidome. Mutation of the G23 into R23, an inhibitory residue, nullified the response, suggesting that the G23 was the P9 anchoring residue. Clone 58 is unreactive to InsB:12–20 or InsB:13–21. c, Comparison of T cell (clone 58) recognition between InsB:11–25 and peptides with varied residues flanking the InsB:15–23 register. The data showed the importance of the flanking residues in T cell recognition. The InsB:15–23 segment without any flanking residues did not induce any responses. Reducing, removing, or mutating the flanking residues at either the amino or carboxy end compromised the recognition to different extents. We note the role of having hydrophobic residues an the carboxy flank: changing the native FF residues into hydrophobic WW preserved the responses. Data (b,c) are representative of n = 2 independent experiments with similar results.
Extended Data Fig. 4
Extended Data Fig. 4. Analysis of the immunogenic segment in InsC peptides.
a, ELISPOT assay showing IFN-γ and IL-2 production by CD4+ T cells from 8-week old male NOD mice immunized with two Ins1C peptides lacking the complete C-terminus upon recalling with indicated relevant peptides. Responses to either Ins1C:41–55 (left) or Ins1C:37–56 (right) were indistinguishable from background (no antigen); the positive control (ConA) generated strong responses. Data (mean ± s.e.m.) summarize results from n = 3 independent experiments from n = 6 mice. b, The mass spectrometry spectrum of the synthetic citrullinated Ins1C:53–61 peptide (TLALEVArQ; the lowercase r indicates the presence of citrulline). This spectrum was distinct from the deamidated Ins1C:53–61E peptide found in the islet MHCII peptidome, confirming that the biologically induced PTM was deamidation but not citrullination.
Extended Data Fig. 5
Extended Data Fig. 5. An example of a false positive MHCII-bound HIP.
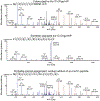
Mass spectrum of a putative Ins1C-ChgA (PQVEQLEL-WSRMDQLAK) peptide in the islet MHCII peptidome (upper) that failed to match the synthetic standard peptide (middle). Further analysis suggested a probable correct match of the putative Ins1C-ChgA HIP to an Ins1C peptide fragment with sodium adduct (lower).
Figure 1.
Figure 1.. Analysis of the β-cell-derived peptides identified in the MHCII peptidome.
a, Epitope mapping by Gibbs cluster analysis of all the MHCII-bound peptides from the spleen of 8–10-week old NOD.I-Ag7 (left) and NOD.I-Ab (right) mice. b-d, Individual β-cell-derived peptides identified in the MHCII peptidomes of the pancreatic islets and the peripheral lymphoid tissues (Islet+periphery; left) or in the islets alone (Islet only; right) were examined for their corresponding T cell autoreactivity (b), relative MHCII binding affinity (c) and relative abundance (d). b, ELISPOT assay showing IL-2 and IFN-γ production by CD4+ T cells from islets and pLN in 8–10-week old female NOD mice upon challenging and recalling with the indicated peptides. NE, not examined. Data (mean ± s.e.m.) are from n = 5 mice per independent experiment (each data point). c, Competitive binding assay showing the relative MHCII binding affinity of the indicated peptides. Data (mean) are from n = 2 independent experiments with similar results. d, Abundance (normalized peak area) of the indicated peptides relative to the most abundant peptide (Ins2C:33–63). Data (mean) are from the mass spectrometry analysis of the MHCII peptidome of the pancreatic islets isolated from n = 219 female NOD mice of 8–10-week of age. e, ELISPOT assay showing IL-2 and IFN-γ production by CD4+ T cells from islets and pLN in female NOD mice of different ages upon challenging and recalling with the indicated peptides. Data (mean ± s.e.m.) are from n = 5 mice per independent experiment (each data point).
Figure 2.
Figure 2.. Diverse InsB-derived peptides induce diabetogenic CD4+ T cells.
a, Summary of the InsB-derived peptides identified in the MHCII peptidome at the indicated sites. The peptides are aligned to the sequence of insulin-1 (top) or insulin-2 (bottom) B-chain. The asterisks denote insulin-1 B-chain peptides. b, ELISPOT assay showing IL-2 and IFN-γ production by CD4+ T cells from islets and pLN in 8–10-week old female NOD mice upon challenging with InsB:9–23 and recalling with the indicated epitopes. Data (mean ± s.e.m.) are from n = 5 mice per independent experiment (each data point). c, Antigen presentation assay showing responses of two representative InsB:11–25-reactive CD4+ T cell hybridomas, clone 21 (left) and clone 58 (right), to C3g7 APCs pulsed with the indicated epitopes. Data (mean) are representative n = 3 independent experiments with similar results. d, ELISPOT assay showing IL-2 and IFN-γ production by CD4+ T cells from islets and pLN in 8–10-week old female NOD mice upon challenging with InsB:11–25 and recalling with indicated epitopes. Data (mean ± s.e.m.) are from n = 5 mice per independent experiment (each data point). e, Antigen presentation assay showing responses of the clone 21 and clone 58 CD4+ T cell hybridomas to dispersed islet cells in cultures with indicated glucose concentrations. Data (mean ± s.e.m.) are from n = 4 independent experiments. f, Competitive binding assay showing the relative MHCII binding affinity of InsB:9–23 versus InsB:11–25. Data (mean) are from n = 2 independent experiments with similar results. g, Antigen presentation assay showing the responses of the InsB:12–20-specific CD4+ T cell hybridoma (9B9) to C3g7 APCs briefly pulsed with the indicated peptides followed by extensive washes at the indicated time points. Data are representative of n = 3 independent experiments with similar results. h, Diabetes incidence of NOD.Rag1–/– mice transferred with primary CD4+ T cell lines to InsB:11–25. Data are from n = 2 independent experiments from n = 19 mice.
Figure 3.
Figure 3.. Pathogenic CD4+ T cells recognize native and deamidated epitopes included in Ins1C-derived peptides.
a, Summary of the peptide sequences derived from Ins1C (left) or Ins2C (right) identified in the MHCII peptidome at the indicated sites. The lower case d denotes the site of deamidation. b, ELISPOT assay showing IL-2 and IFN-γ production by CD4+ T cells from 8-week old male NOD mice immunized with a long Ins1C:33–63 peptide and recalling with indicated segments. Data (mean ± s.e.m.) are from n = 6 mice from n = 3 independent experiments (each data point). c, Diabetes incidence of NOD.Rag1–/– mice transferred with a primary CD4+ T cell line specific to Ins1C:49–63. Data are from n = 2 independent experiments from n = 10 mice. d, A mirror plot showing the match of the deamidated Ins1C:53–61E peptide identified in the islet MHCII peptidome (upper) with the synthetic version (lower). e, Competitive binding assay showing the relative MHCII binding affinity of the native Ins1C:51–61 versus the deamidated Ins1C:51–61E and Ins1C:53–61E. Data (mean) are from n = 2 independent experiments with similar results. f, Antigen presentation assay showing responses of a representative Ins1C:51–61E-reactive CD4+ T cell clone to C3g7 APCs pulsed with indicated peptides (left). The dot plot (right) shows the amounts of the peptides required for reaching the half-maximal responses (Peptide EC50). Data are from n = 7 clones (each data point) tested in n = 4 independent experiments. P values: *P = 0.0358. g, ELISPOT assay showing IL-2 and IFN-γ production by CD4+ T cells from islets and pLN in 8–10-week old female NOD mice upon challenging with Ins1C:51–61 (left) or Ins1C:51–61E (right) and recalling with indicated peptides. Data (mean ± s.e.m.) are from n = 25 mice from n = 5 independent experiments (each data point). P values for Ins1C:51–61: *P = 0.0121; **P = 0.0062. P values for Ins1C:51–61E: *P = 0.0156; ***P = 0.0004. P values (f, g) were calculated using an unpaired two-tailed Student’s t-test.
Figure 4.
Figure 4.. Validation of the potential HIPs identified in the MHCII peptidomes and the free HIPs shared between the crinosomes and the secretome.
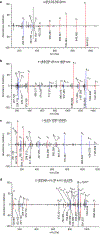
a, A mirror plot showing the match of an InsC-IAPP HIP (LQTLAL-NAARD; upper) identified in the islet MHCII peptidome with the synthetic standard (lower). An identical spectrum of this HIP was identified in the MHCII peptidome of the pLN. b-d, Three potential free HIPs were identified both in the crinosomes and the secretome. b, A mirror plot showing the match of an InsC-IAPP HIP (EVED-TPVRSGTNPQM; upper) to the synthetic standard (lower). c, A mirror plot showing the match of an InsC-Ins2C HIP (LAL-EVEDPQVAQ; upper) to the synthetic standard (lower). d, A mirror plot showing the match of an InsC-IAPP HIP (EVED-NAARDPNRESLDFL; upper) to the synthetic standard (lower). The spectra in b-d are from the secretome; identical spectra were observed in the crinosomes.

References

    1. Hattori M et al. The NOD mouse: recessive diabetogenic gene in the major histocompatibility complex. Science 231, 733–735 (1986). - PubMed
    1. Todd JA, Bell JI & McDevitt HO HLA-DQ beta gene contributes to susceptibility and resistance to insulin-dependent diabetes mellitus. Nature 329, 599–604 (1987). - PubMed
    1. Acha-Orbea H & McDevitt HO The first external domain of the nonobese diabetic mouse class II I-A beta chain is unique. Proc. Natl. Acad. Sci. U.S.A 84, 2435–2439 (1987). - PMC - PubMed
    1. Miyazaki T et al. Direct evidence for the contribution of the unique I-ANOD to the development of insulitis in non-obese diabetic mice. Nature 345, 722–724 (1990). - PubMed
    1. Corper AL et al. A structural framework for deciphering the link between I-Ag7 and autoimmune diabetes. Science 288, 505–511 (2000). - PubMed

Publication types