. 2020 Apr;580(7805):663-668.
doi: 10.1038/s41586-020-2117-z. Epub 2020 Mar 9.

An open-source drug discovery platform enables ultra-large virtual screens

Affiliations

An open-source drug discovery platform enables ultra-large virtual screens

Christoph Gorgulla et al. Nature. 2020 Apr.

Abstract

On average, an approved drug currently costs US$2-3 billion and takes more than 10 years to develop1. In part, this is due to expensive and time-consuming wet-laboratory experiments, poor initial hit compounds and the high attrition rates in the (pre-)clinical phases. Structure-based virtual screening has the potential to mitigate these problems. With structure-based virtual screening, the quality of the hits improves with the number of compounds screened2. However, despite the fact that large databases of compounds exist, the ability to carry out large-scale structure-based virtual screening on computer clusters in an accessible, efficient and flexible manner has remained difficult. Here we describe VirtualFlow, a highly automated and versatile open-source platform with perfect scaling behaviour that is able to prepare and efficiently screen ultra-large libraries of compounds. VirtualFlow is able to use a variety of the most powerful docking programs. Using VirtualFlow, we prepared one of the largest and freely available ready-to-dock ligand libraries, with more than 1.4 billion commercially available molecules. To demonstrate the power of VirtualFlow, we screened more than 1 billion compounds and identified a set of structurally diverse molecules that bind to KEAP1 with submicromolar affinity. One of the lead inhibitors (iKeap1) engages KEAP1 with nanomolar affinity (dissociation constant (Kd) = 114 nM) and disrupts the interaction between KEAP1 and the transcription factor NRF2. This illustrates the potential of VirtualFlow to access vast regions of the chemical space and identify molecules that bind with high affinity to target proteins.


Conflict of interest statement

Competing interests The authors declare the following competing interests: I.I., D.S.R., and Ye.M. work for Enamine, a company that is involved in the synthesis and distribution of drug-like compounds. Yu.M. is a scientific advisor to Enamine.

Figures

Extended Data Fig. 1:
Extended Data Fig. 1:. Schematic overview of the organization of the VirtualFlow workflow on computer clusters.
A computer cluster consists of compute nodes, i.e. single computers (blue boxes), which contain a certain number of CPU cores (black squares inside the blue boxes). The resource manager (batch system) of the cluster employs so-called jobs (large violet oval shapes), each of which uses a certain number of CPU cores and nodes. In the example shown above, each job uses three compute nodes, where each node has 8 CPU cores. Each job can employ multiple sub jobs, referred to as job steps (purple circles). With VirtualFlow, each job step employs multiple queues (white oval shapes within the purple circles). Often the workflow is setup such that on each CPU core one queue is running. The hierarchical multi-organization is required to allow VirtualFlow to run on any type of cluster, from the largest supercomputers (which often require that a single job employs multiple nodes) to very small clusters (which often allow a job to use single CPU cores). Each queue processes ligands, which are taken from the input collections in raw form and stored in the output collection/database. The central task list contains all the ligand collections which should be processed by the workflow, and they are distributed among the queues (into local task lists) by a workload balancer at the beginning of each job. The user can choose any number of batch system jobs (first row with Job 1.1 through Job X.1), which will automatically start successive jobs (second row with Job 1.2 through X.2) after their completion.
Extended Data Fig. 2:
Extended Data Fig. 2:. Overview of possible processing steps during the ligand preparation with VFLP.
Ligands can be desalted, neutralized, (possibly multiple) tautomeric states can be generated, protonation states for each tautomer computed at specific pH values, 3D coordinates computed, and finally the molecules can be converted into (potentially multiple) desired target formats.
Extended Data Fig. 3:
Extended Data Fig. 3:. Docking and virtual screening metrics.
a, Scaling behaviour of VFVS using QuickVina 2 as the docking program. Tests with up to 30,000 cores on two local computer clusters (LC1, LC2) and up to 160,000 CPUs on the Google Cloud Platform were carried out. The measured speedup is linear. DOVIS 2.0, an alternative software for virtual screenings on Linux computer clusters using AutoDock, was shown to exhibit near-linear scaling only up to 256 cores as previously reported. b,The computational time required (in days) for VFVS to complete virtual screens of different sizes, as a function of the number of CPUs being used in parallel. Each curve corresponds to a different size input ligand library, and the average computation time per ligand was assumed to be 5 seconds per ligand. c, Docking time of an average-sized ligand on a modern Intel CPU (using only a single core) as a function of the exhaustiveness parameter for different docking programs supported by VFVS. The bar plot in the inset shows the slope of the curves, which corresponds to the docking time per exhaustiveness unit. The test ligand which was used for this purpose is given by the SMILES code CN1CCN(S(=O)(=O)N2CCN(C(=O)CCCNC(=O)C3CC3)CC2)CC1. More detailed benchmarks can be found in publications related to these docking programs,,,,,,.
Extended Data Fig. 4:
Extended Data Fig. 4:. Binding of the NRF2 peptide to KEAP1 as assayed by FP (a) and BLI (b).
a, For the FP assay a TAMRA-tagged NRF2 peptide and for the BLI assay a Biotin-tagged NRF2 peptide were used. The FP assay was performed with three technical replicates per point. The mean and standard deviation are shown for each titration point, along with the fitted curve. Two independent experiments (n=2) were performed, each with similar results and one representative result is shown here. b, For the BLI assay a biotin-tagged NRF2 peptide was used. The BLI experiment was repeated independently twice (n=2) with similar results and one representative result is shown here.
Extended Data Fig. 5:
Extended Data Fig. 5:. Comparison of iKeap1 with a previously identified displacer C17.
a, Crystal structure (PDB ID: 5FNQ) of KEAP1 with its ligand removed, the structure used for the primary virtual screening procedure. b, Crystal structure of KEAP1 (PDB code 4IQK) with ligand C17 (Supplementary Table 1), which is also shown in panel d. c, iKeap1, the best binder as accessed by array of experimental validations, is similar to compound C17 previously identified by experimental methods (d). Though iKeap1 and C17 look similar they differ in a number of aspects in their core scaffold (therefore analogues of the two compounds cover distinct chemical spaces, assuming the analogues retain the core scaffold of the parent compound). This similarity, as well as the fact that the predicted docking positions (Fig. 3a) of both ligands (b) are nearly identical, is an additional evidence that iKeap1 is binding at the predicted site.
Extended Data Fig. 6:
Extended Data Fig. 6:. Overview of binding assays to determine the activity of the hits identified by VirtualFlow.
The binding experiments can be broadly classified into two categories i) assays that directly detect binding of the compounds to KEAP1 (SPR, NMR), and ii) assays that detect the displacement of the NRF2-peptide from KEAP1 (FP, BLI). Compounds in SPR Level-2 were classified as active if they exhibited dose-dependent activity (measured over a range of five concentrations) and had an RU value greater than 4 at a compound concentration of 20 μM.
Extended Data Fig. 7:
Extended Data Fig. 7:. Binder versus displacer.
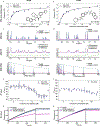
Here we highlight two new scaffolds, iKeap8 and iKeap9, to illustrate the difference between binders and displacers. SPR confirms that both iKeap8 and iKeap9 bind KEAP1 (a and b) with similar Kd values. Shown are representative results from the SPR assay for iKeap8 and iKeap9. For each compound, three independent SPR experiments were performed, each with similar results and one representative result is shown here. Ligand-detected NMR experiments shows that both iKeap8 and iKeap9 bind to KEAP1 (c and d). However, FP (e and f) and BLI (g and h) assays show that iKeap8 is able to displace the NRF2 peptide while iKeap9 is not able to effectively displace the NRF2 peptide. The fluorescence polarization (FP) assay was performed with three technical replicates per concentration measured. The mean and standard deviation are shown for each titration point, along with the fitted curve.
Extended Data Fig. 8:
Extended Data Fig. 8:. Displacers validated by FP versus BLI.
Here we take the opportunity to present two more displacers, iKeap7 and iKeap22, both of which were confirmed as binders by SPR (top panels). Ligand-detected NMR experiments shows that both iKeap7 and iKeap22 bind to KEAP1 (c and d). iKeap7 is confirmed to be a displacer of the NRF2 peptide by both FP (bottom left panel) and BLI (not shown). Since the FP experiments on iKeap22 were affected by autofluorescence, BLI (bottom right panel) was needed to confirm that this compounds is a displacer. The FP assay was performed with three technical replicates per concentration measured. The mean and standard deviation are shown for each titration point, along with the fitted curve. Two independent BLI experiment were performed with similar results and one representative result shown here.
Extended Data Fig. 9:
Extended Data Fig. 9:. NRF2 peptide and ligand binding sites, rationale for binder versus displacer.
Here we show the docking pose of one of the hit compounds (iKeap9, green ball-and-stick representation) bound to KEAP1, together with the NRF2 peptide (PDB ID: 4IFL; peptide in violet). iKeap9 is a tight binder (180 nM by steady-state SPR) but cannot displace NRF2. The left figure shows the top view, while the right figure shows the side view of the cross-section of KEAP1 along the central plane. The violet box in right figure indicates the docking region (where the ligands were allowed to bind) which was used in the virtual screening. The site of interest includes a part of the deep pocket/tunnel of the β-barrel-shaped KEAP1, since it can allow ligands to bind more tightly by insertion into the channel than on a shallow surface. However, the deep tunnel is largely non-overlapping with the peptide binding site (which binds to the entrance site of the tunnel). Thus, binding molecules might only partially interfere with the peptide binding, which might reduce or eliminate the ability of small molecule binders to displace the peptide. The ability of a small molecule to displace the peptide is hard to predict, and was not attempted in this study. In some cases, small molecules can also act as molecular glues and strengthen the interaction between NRF2 and KEAP1.
Figure 1:
Figure 1:. Application of VirtualFlow to the drug discovery process.
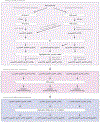
Before the screening can begin, the target structure, which is generally obtained from X-ray, NMR, cryo-EM, or homology modelling studies, needs to be prepared. The preparation step can include molecular dynamics (MD) simulations to obtain one or more relevant conformations of the target protein. Once the structure is prepared, it can be used to identify novel hit compounds by virtual screening-based approaches. The two independent modules of VirtualFlow, VFLP (VirtualFlow for Ligand Preparation) and VFVS (VirtualFlow for Virtual Screening), are designed to aid virtual screening-based needs. VFLP prepares (blue arrow) the desired chemical space into ready-to-dock ligand libraries, which can subsequently be used by VFVS during the virtual screen. The virtual screen consists normally of a primary virtual screening (stage-1), but can also be implemented in a multi-stage setting (violet arrows), which can include protein-side chain flexibility or inclusion of multiple protein conformations (e.g., from the MD simulations or NMR structures). In addition, complimentary software packages can be leveraged during multi-staged screening (for example to carry out quantum mechanics (QM)-based free energy simulations as a final step) to improve the true hit rate and estimated binding affinities. After the virtual screening procedure, experimental verification can be carried out to identify true binders. Promising binders (lead compounds) can be further optimized by creating custom analogue libraries and screening them again with VirtualFlow (golden arrows), followed again by experimental verification of the hits.
Figure 2:
Figure 2:. Schematic overview of the multi stage screen and benefits of ultra-large scale screens.
a, In stage-1, ∼1.3 billion compounds were screened with the fast docking program QuickVina 2 at the lowest accuracy level. In stage-2, 13 residues of the receptor were allowed to be flexible and the top ∼3 million scoring compounds were rescored with higher accuracy using AutoDock Vina and Smina Vinardo. b, Violin plots of the docking scores of the top 50 molecules from virtual screens targeting KEAP1 with different starting library sizes (0.1, 1, 10, 100, 1000 million ligands). In order to mimic virtual screens of smaller sizes we randomly chose a subset of the ligands from the ∼1 billion compound screen of the REAL library and considered the scores of the top 50 compounds. The docking score is an estimation of the free energy of binding (in kcal/mol), and therefore the more negative the value the tighter the binding of the hit to the target. The given distributions show that the docking score of the top 50 compounds improves with the scale of the screen. The procedure was repeated independently five times with similar results.
Figure 3:
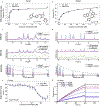
Figure 3:. Docking poses (a-b) and experimental verification (c-h) of two hit compounds (iKeap1 and iKeap2).
The docking poses (a and b) were obtained from stage-2 of the virtual screening. SPR steady-state binding curves are shown for iKeap1 (c) and iKeap2 (d), showing clear binding with nanomolar Kd. We show one representative data from three independent experiments (n=3) with similar results. Ligand-detected NMR experiments,CPMG-R2 and STD-NMR (e and f) confirm the binding of the two compounds. The two hits were also functional in the FP assay (g and h) confirming that the compounds displace the peptide. The FP data shown here is from three technical replicates and the curve was fitted to the average value of the three the technical replicates. The mean and the standard deviation for the individual data points are shown. The FP was repeated independently twice with similar results and one representative result is shown here.

References

    1. DiMasi JA, Grabowski HG & Hansen RW Innovation in the pharmaceutical industry: New estimates of R&D costs. Journal of Health Economics 47, 20–33 (2016). - PubMed
    1. Lyu J, Wang S, Balius TE, et al.Ultra-large library docking for discovering new chemotypes. Nature (2019). - PMC - PubMed
    1. Zhang S, Kumar K, Jiang X, et al.DOVIS: an implementation for high-throughput virtual screening using AutoDock. BMC bioinformatics 9, 126 (2008). - PMC - PubMed
    1. Jiang X, Kumar K, Hu X, et al.DOVIS 2.0: an efficient and easy to use parallel virtual screening tool based on AutoDock 4.0. Chemistry Central Journal 2, 18 (2008). - PMC - PubMed
    1. Hassan NM, Alhossary AA, Mu Y, et al.Protein-Ligand Blind Docking Using QuickVina-W With Inter-Process Spatio-Temporal Integration. Scientific Reports 7, 15451 (2017). - PMC - PubMed

Publication types

MeSH terms