. 2020 Sep 29;22(9):1368-1378.
doi: 10.1093/neuonc/noaa053.

Longitudinal evaluation of peripheral nerve sheath tumors in neurofibromatosis type 1: growth analysis of plexiform neurofibromas and distinct nodular lesions

Affiliations

Longitudinal evaluation of peripheral nerve sheath tumors in neurofibromatosis type 1: growth analysis of plexiform neurofibromas and distinct nodular lesions

Srivandana Akshintala et al. Neuro Oncol. .

Abstract

Background: Understanding the natural history of non-malignant peripheral nerve sheath tumors (PNSTs) in neurofibromatosis type 1 (NF1) is critical to optimal clinical care and the development of meaningful clinical trials.

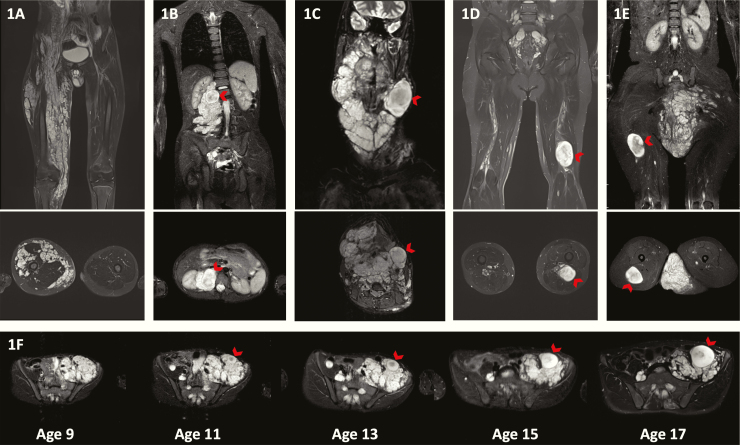
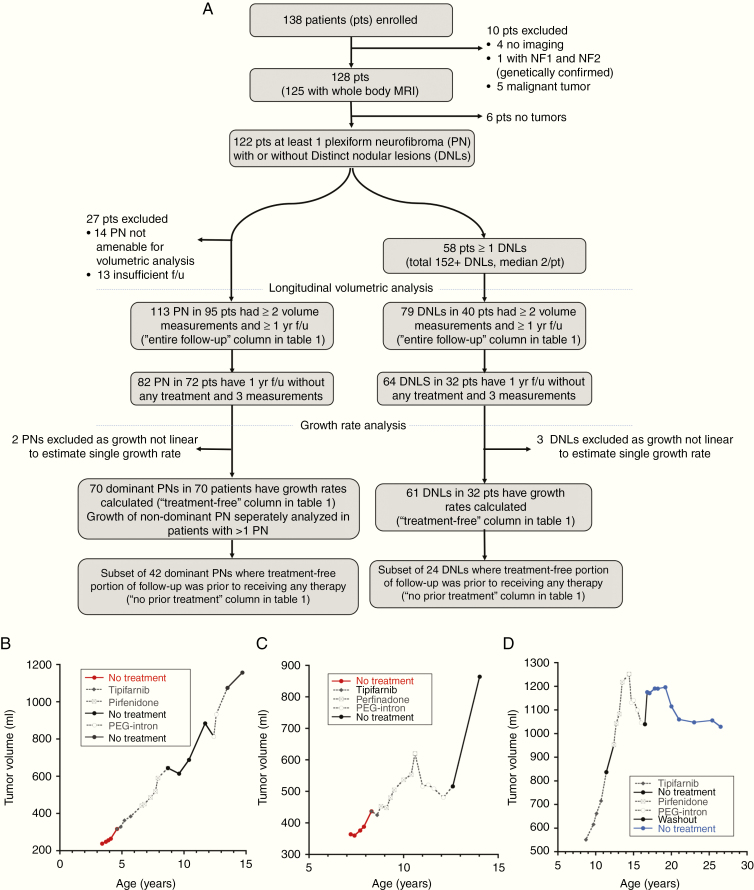
Methods: We longitudinally analyzed growth of plexiform neurofibromas (PNs) and of PNSTs with distinct nodular appearance (distinct nodular lesions [DNLs]) using volumetric MRI analysis in patients enrolled on a natural history study (NCT00924196).

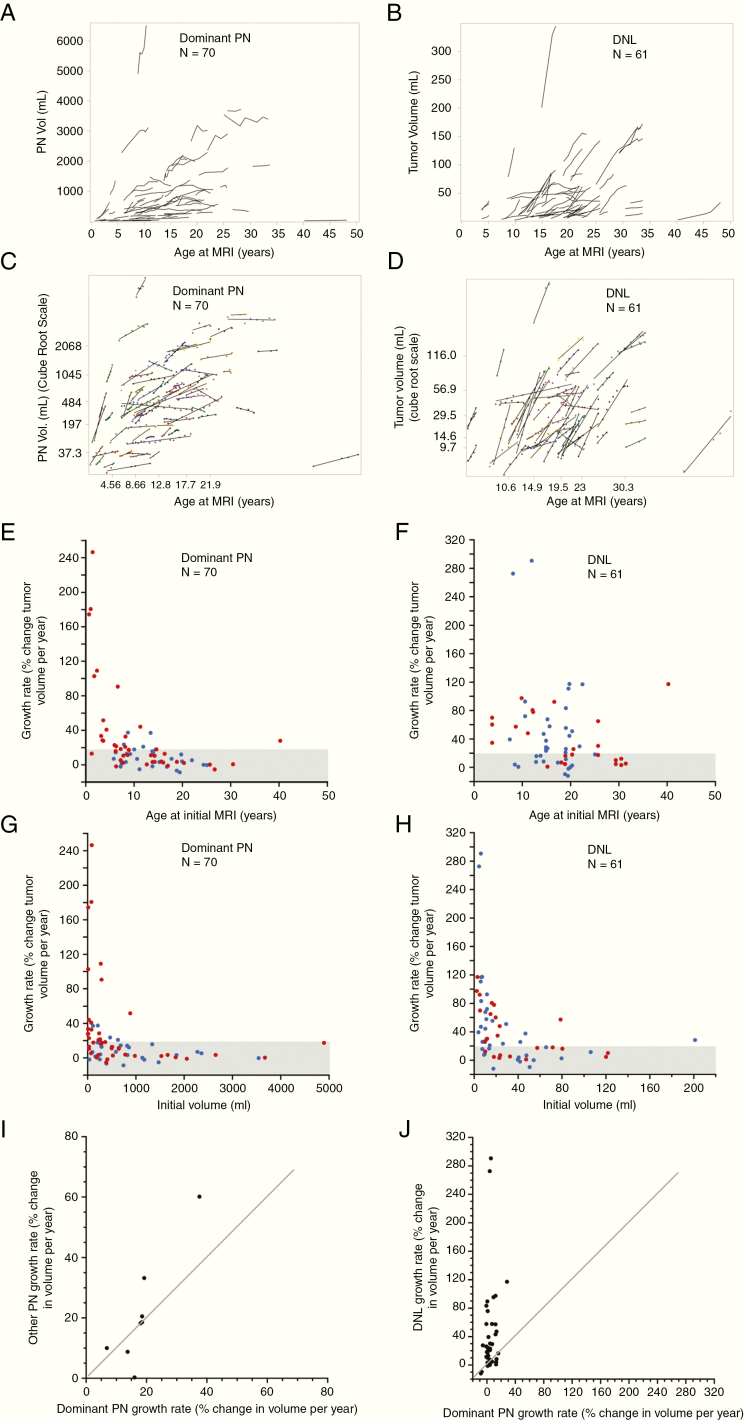
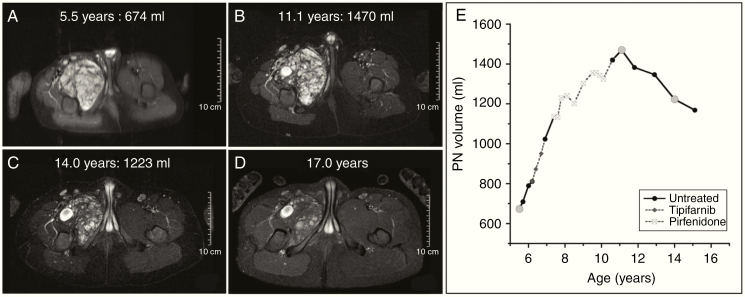
Results: DNLs were observed in 58/122 (45.6%) patients (median 2 DNLs/patient). In DNLs that developed during follow-up, median age of development was 17 years. A moderate negative correlation was observed between the estimated PN growth rate and patients' age at initial MRI (Spearman's r [95% CI]: -0.60 [-0.73, -0.43], n = 70), whereas only a weak correlation was observed for DNLs (Spearman's r [95% CI]: -0.25 [-0.47, 0.004]; n = 61). We observed a moderate negative correlation between tumor growth rate and baseline tumor volume for PNs and DNLs (Spearman's r [95% CI]: -0.52 [-0.67, -0.32] and -0.61 [-0.75, -0.42], respectively). Spontaneous tumor volume reduction was observed in 10 PNs and 7 DNLs (median decrease per year, 3.6% and 7.3%, respectively).

Conclusion: We corroborate previously described findings that most rapidly growing PNs are observed in young children. DNLs tend to develop later in life and their growth is minimally age related. Distinct growth characteristics of PNs and DNLs suggest that these lesions have a different biology and may require different clinical management and clinical trial design. In a subset of PNs and DNLs, slow spontaneous regression in tumor volume was seen.

Keywords: atypical neurofibroma; neurofibromatosis; plexiform neurofibroma; volumetric MRI.


Figures

Fig. 1
Fig. 1
(A) Coronal and axial MRIs of a PN without any DNLs. (B) DNL present within a PN, (C) adjacent to a PN, (D) associated with a major nerve, or (E) outside of a PN. The arrow points to the DNL. (F) Axial MR images showing development of a DNL over time. On the MRI performed at 9 years of age, the tumor appears like a PN with no DNL identifiable even in retrospect. At 11 years, one nodule appears to stand out from the background but does not reach the 3 cm size to classify as a DNL. However, the DNL was evident by age 13 and had grown out of proportion to the plexiform on the MRIs performed at ages 15 and 17.
Fig. 2
Fig. 2
(A) Flow diagram describing the patient cohort included in the analysis. (B–D) Examples of growth plots of different tumors during the entire period of follow-up (f/u). Periods during which patients received any medical treatment are shown in gray dotted lines and periods where no treatment was received are shown in continuous lines. The first “treatment-free” portion of follow-up for which growth rate was calculated is highlighted in color. (B) An example of a growth plot where the treatment-free portion was representative of the entire period of follow-up as the treatments did not appear to affect tumor growth. (C) An example of a growth plot where the treatments appear to transiently affect tumor growth. However, after coming off treatment, the tumor growth resumed such that the treatment-free growth rate estimates the overall growth. In these examples, the first “treatment-free” portion of follow-up is shown in red and patients had not received any prior tumor-targeting medical therapies (no-prior-treatment subgroup). (D) An example of a plot where the treatment-free portion of follow-up captured only the period where the tumor growth appears to have stabilized and does not include the initial growth period. Here the first treatment-free portion of follow-up is shown in blue and this was after patient had come off medical therapies targeting PNs.
Fig. 3
Fig. 3
Tumor volume plotted against patient’s age for the dominant PNs (A) and DNLs (B). Each tumor is shown as a series of line segments. (C, D) Tumor volume plotted against patient’s age for the dominant PNs (C) and DNLs (D), but here the PNST volume is transformed (cube root), quartiles and 10th/90th percentiles are indicated on both axes, and linear regression lines are plotted along with the data (dots). (E, F) Association between estimated tumor growth rate to patient’s age at initial MRI for dominant PNs (E) and DNLs (F). A moderate negative correlation was observed for PNs, whereas only a weak Fig. 3 Continued. association was noted for DNLs. (G, H) Association between estimated tumor growth rate to initial tumor volume for dominant PNs (3G) and DNLs (H). A moderate negative correlation was observed for PNs and DNLs. (E–H) The 42 dominant PNs and 24 DNLs which had not received any tumor-directed medical therapies prior to the “treatment-free” portion of follow-up for which growth rates were calculated (no prior treatment subset) are shown in red, and the remaining PNs and DNLs are shown in blue. (I) Growth rates of the non-dominant PN relative to the growth rate of the dominant PN in the 7 patients (8 non-dominant PNs) who had multiple PNs where tumor volumes were measured over the same follow-up period. No pattern could be noted in our small number of patients. (J) Growth rates of the DNLs relative to the growth rate of the patients’ dominant PN in 26 patients (42 DNLs) where volumes were measured over the same follow-up period. The diagonal lines on I and J indicate the points where the growth rates are equal.
Fig. 4
Fig. 4
(A–D) Serial MR images for patient whose tumor increased in size from 674 mL (A) to maximum of 1470 mL (B) and subsequently decreased in size spontaneously (C–D). (E) Tumor volume vs age plot for this PN. Gray circles correspond to the time points for which MR images are presented here. The tumor volume increase occurred both when the patient was not receiving any treatment (shown with black continuous lines) as well as during treatment with tipifarnib and pirfenidone (gray dashed lines). The volume decrease occurred after patient had completed receiving any tumor-directed therapy. During the period of volume decrease, MRI signal intensity also decreased such that by age 17, the tumor appeared smaller and fainter compared with prior scans, but due to change in signal intensity volumetric analysis could no longer be performed. The decrease in volume was seen while patient was not receiving any tumor-directed therapy.

References

    1. Korf BR. Plexiform neurofibromas. Am J Med Genet. 1999;89(1): 31–37. - PubMed
    1. Nguyen R, Kluwe L, Fuensterer C, Kentsch M, Friedrich RE, Mautner VF. Plexiform neurofibromas in children with neurofibromatosis type 1: frequency and associated clinical deficits. J Pediatr. 2011;159:652–655.e652. - PubMed
    1. Dombi E, Solomon J, Gillespie AJ, et al. . NF1 plexiform neurofibroma growth rate by volumetric MRI: relationship to age and body weight. Neurology. 2007;68(9):643–647. - PubMed
    1. Kim A, Gillespie A, Dombi E, et al. . Characteristics of children enrolled in treatment trials for NF1-related plexiform neurofibromas. Neurology. 2009;73(16):1273–1279. - PMC - PubMed
    1. Mautner VF, Asuagbor FA, Dombi E, et al. . Assessment of benign tumor burden by whole-body MRI in patients with neurofibromatosis 1. Neuro Oncol. 2008;10(4):593–598. - PMC - PubMed

Publication types

Associated data