

doi: 10.1107/S1600577520000776.
Epub 2020 Feb 20.
New tools for calibrating diffraction setups
Affiliations
- PMID: 32153298
- PMCID: PMC7842211
- DOI: 10.1107/S1600577520000776
Item in Clipboard
New tools for calibrating diffraction setups
J Synchrotron Radiat.
.
Abstract
New calibration tools in the pyFAI suite for processing scattering experiments acquired with area detectors are presented. These include a new graphical user interface for calibrating the detector position in a scattering experiment performed with a fixed large area detector, as well as a library to be used in Jupyter notebooks for calibrating the motion of a detector on a goniometer arm (or any other moving table) to perform diffraction experiments.
Keywords: geometry calibration; goniometers; moving detectors; pair distribution function; powder diffraction; translation tables.
Figures
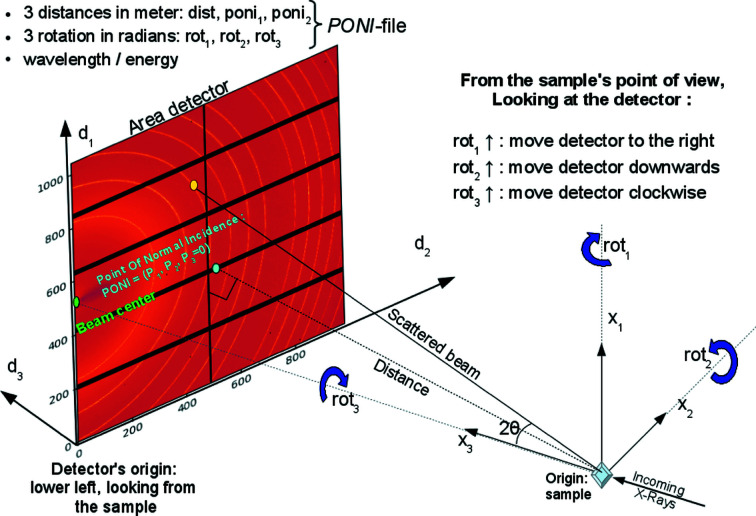
Geometry used in pyFAI.
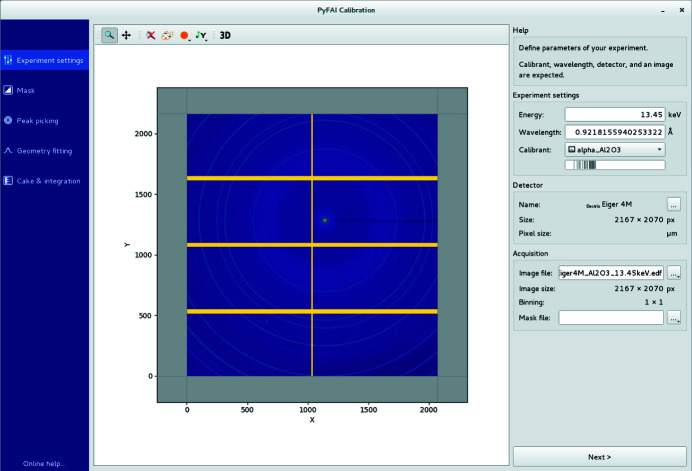
The experiment settings tab is used to load the calibration image, set the energy, the calibrant and select the detector for the subsequent analysis. The binning mode of the detector is automatically guessed.
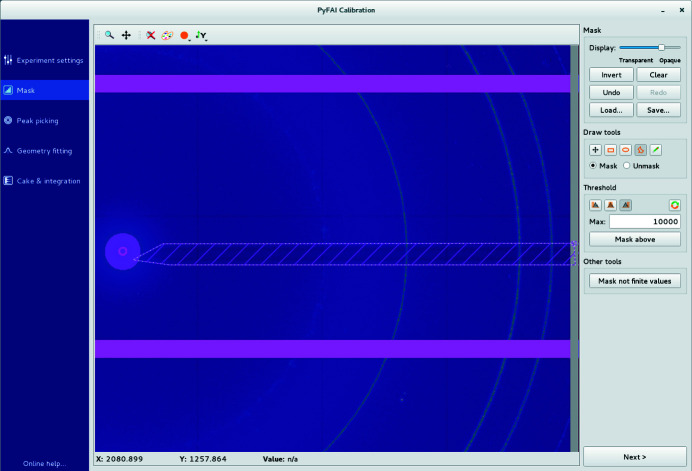
The mask-drawing tool is used to exclude pixels using a rectangular, polygonal or pencil selection. Pixels can also be selected according to their value (thresholding).
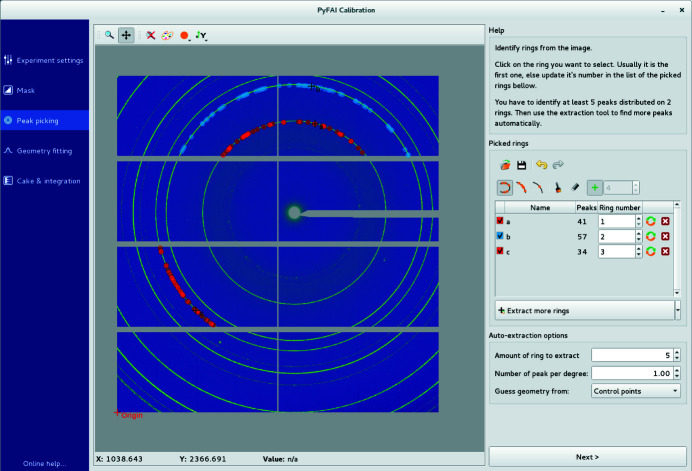
The peak-picking tool automatically selects a group of contiguous local maxima in the image close to the clicked peak which then needs to be assigned to the correct calibrant ring number in the right-hand side panel.
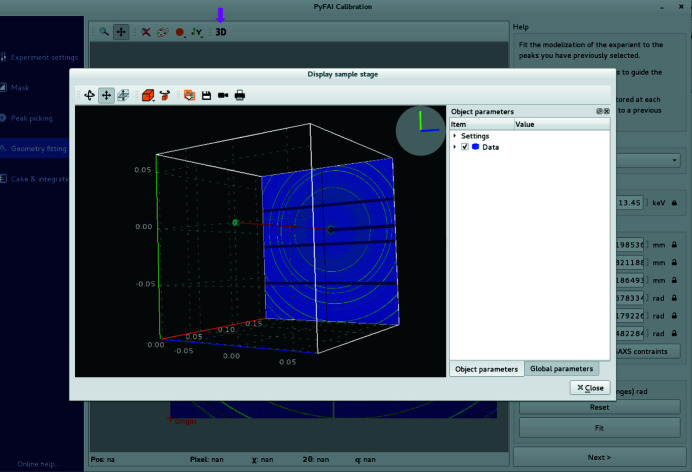
In the geometry fitting tab, each variable can be fixed or left free for refinement within a given range. A 3D representation of the experimental setup allows visualization of the relative position of the sample, direct beam and detector after fitting.
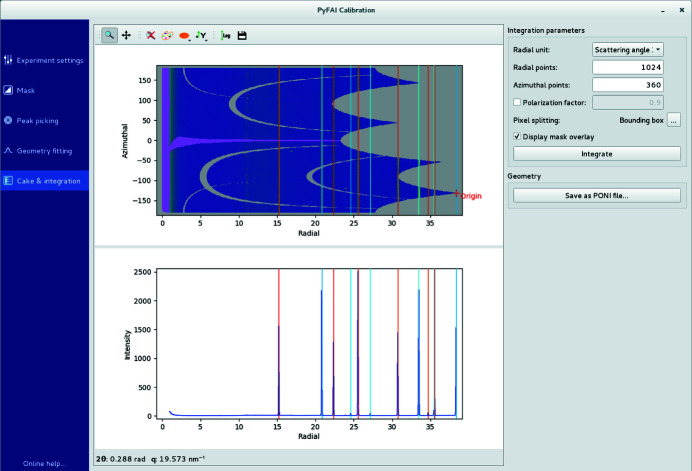
The cake and integration tab displays the 1D curve and 2D integrated image with the calibrant ring positions overlaid to allow easy validation of the quality of the calibration.
Powder diffraction profile obtained from seven images acquired at various distances from 15 cm to 45 cm. The translation table position is combined with six (resp. eight) parameters model-fitted, where dist (resp. dist, poni
1 and poni
2) depends linearly on the table position.
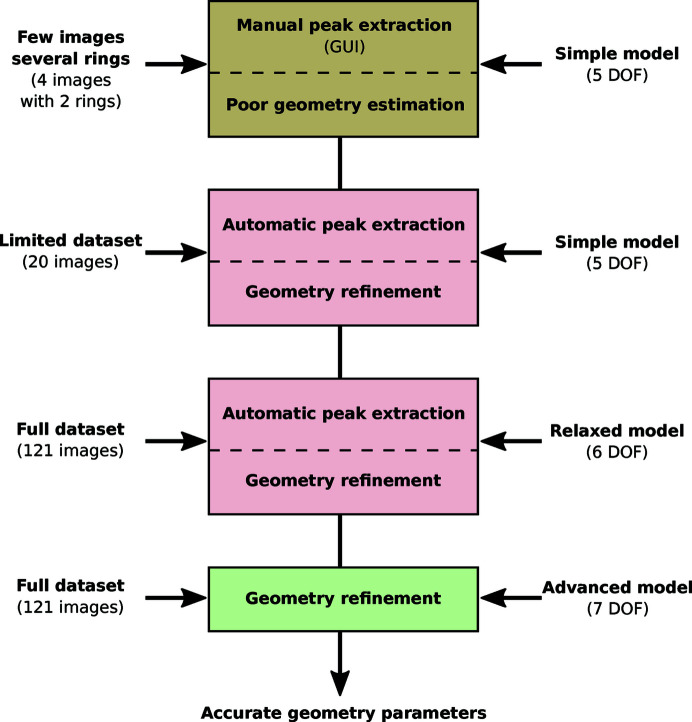
Workflow used to calibrate a set of 121 images collected with a Pilatus 100k mounted on a moving 2θ arm and detailed in the Jupyter Notebook given by Kieffer & Hennig (2017 ▸).
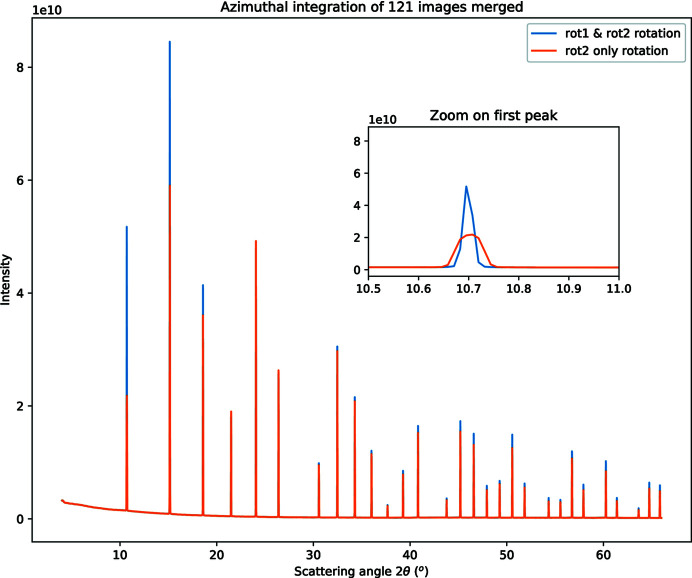
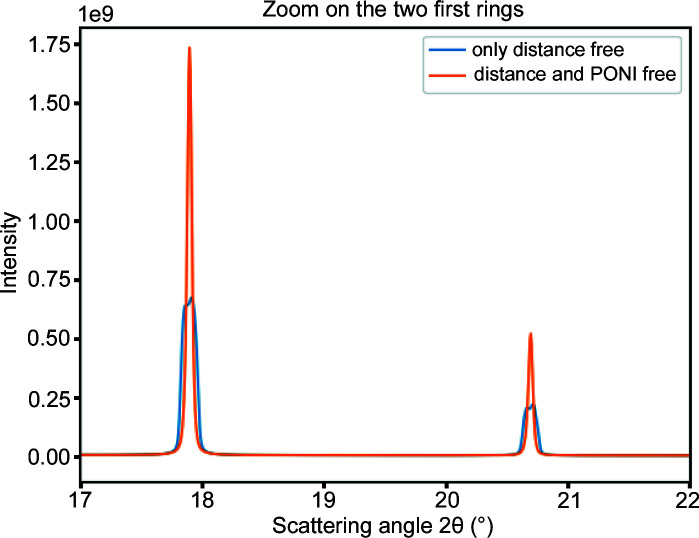
Powder diffraction pattern obtained from 121 Pilatus 100k images acquired at goniometer angles ranging from 5° to 65° on an LaB6 reference sample at 16 keV. The insert is a close-up view of the first peak showing the sharpness of the signal depending on the model. The orange curve corresponds to the simple model where rot
2 depends linearly on the goniometer angle (six DoFs). The blue curve corresponds to an advanced model where both rotations (rot
1 and rot
2) depend linearly on the goniometer angle (seven DoFs).
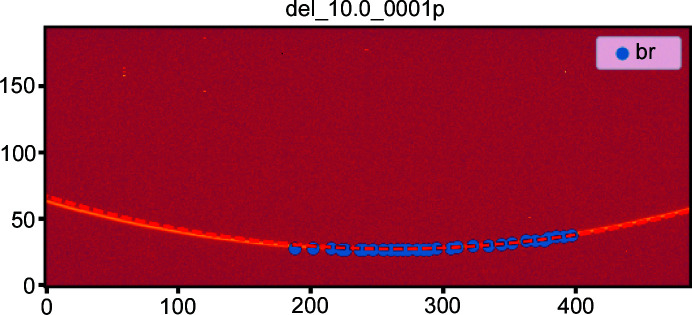
Diffraction image taken with the goniometer arm at 10°. The control points are in blue and the expected ring of the simple model [rot
2 = f(pos)] is the dashed red line. This highlights the need for rot
1 to depend on the goniometer position.
References
-
- Boesecke, P. (2007). J. Appl. Cryst. 40, s423–s427.
-
- Boudet, N., Berar, J.-F., Blanquart, L., Breugon, P., Caillot, B., Clemens, J.-C., Koudobine, I., Delpierre, P., Mouget, C., Potheau, R. & Valin, I. (2003). Nucl. Instrum. Methods Phys. Res. A, 510, 41–44.
-
- Chupas, P. J., Qiu, X., Hanson, J. C., Lee, P. L., Grey, C. P. & Billinge, S. J. L. (2003). J. Appl. Cryst. 36, 1342–1347.
Grants and funding
LinkOut - more resources
Full Text Sources
Other Literature Sources
