. 2020 Feb 21:14:23.
doi: 10.3389/fnhum.2020.00023. eCollection 2020.

Altered Rich-Club Organization and Regional Topology Are Associated With Cognitive Decline in Patients With Frontal and Temporal Gliomas

Affiliations

Altered Rich-Club Organization and Regional Topology Are Associated With Cognitive Decline in Patients With Frontal and Temporal Gliomas

Yong Liu et al. Front Hum Neurosci. .

Abstract

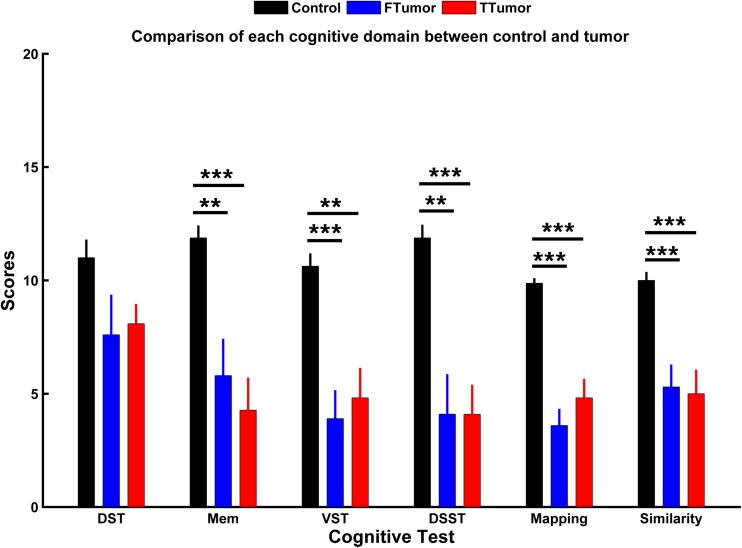
Objectives: Gliomas are widely considered to be related to the altered topological organization of functional networks before operations. Tumors are usually thought to cause multimodal cognitive impairments. The structure is thought to form the basics of function, and the aim of this study was to reveal the rich-club organization and topological patterns of white matter (WM) structural networks associated with cognitive impairments in patients with frontal and temporal gliomas.

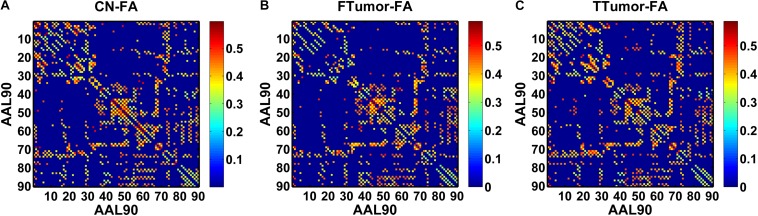
Methods: Graph theory approaches were utilized to reveal the global and regional topological organization and rich-club organization of WM structural networks of 14 controls (CN), 13 frontal tumors (FTumor), and 18 temporal tumors (TTumor). Linear regression was used to assess the relationship between cognitive performances and altered topological parameters.

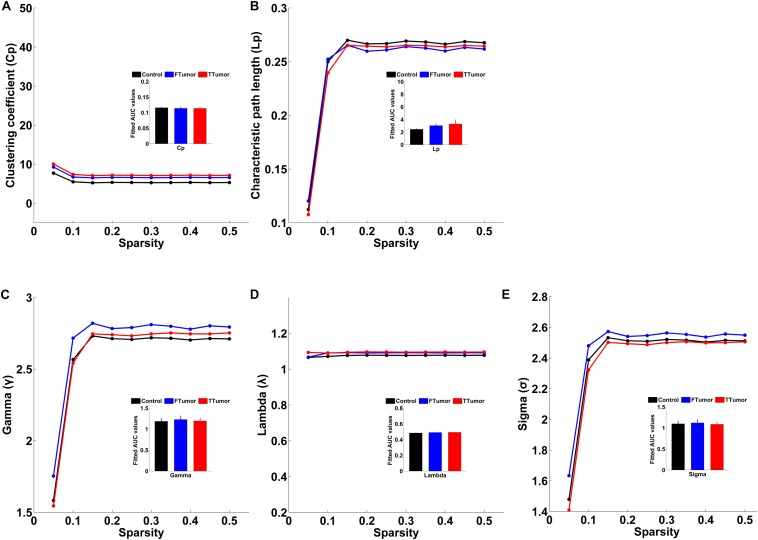
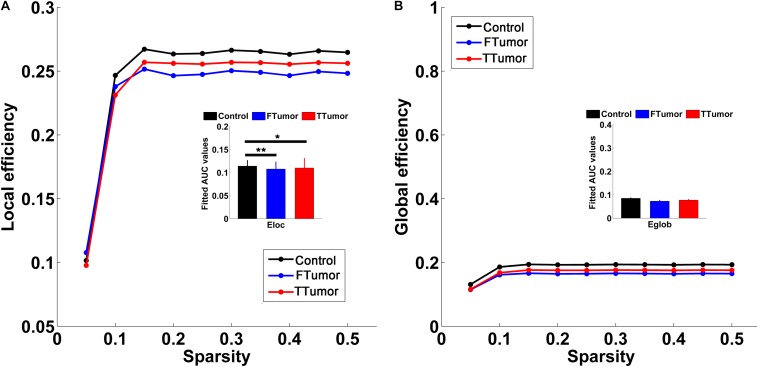
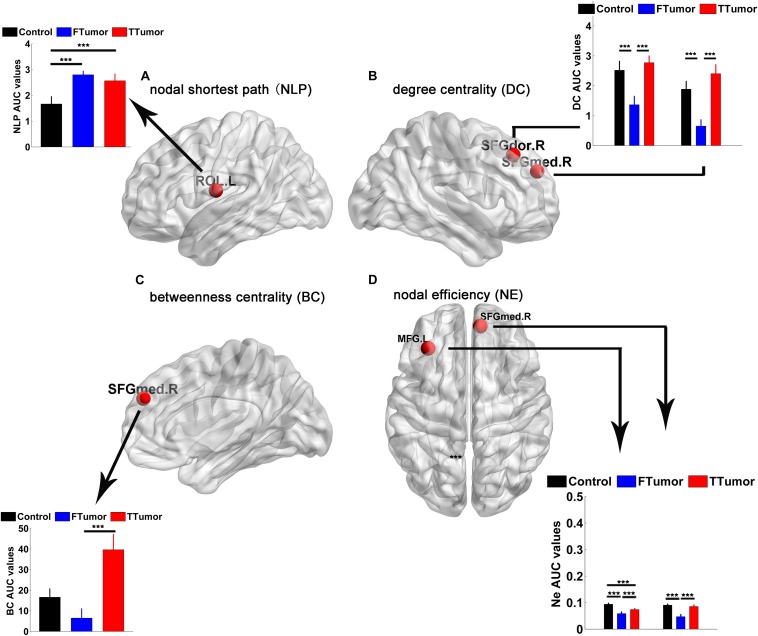
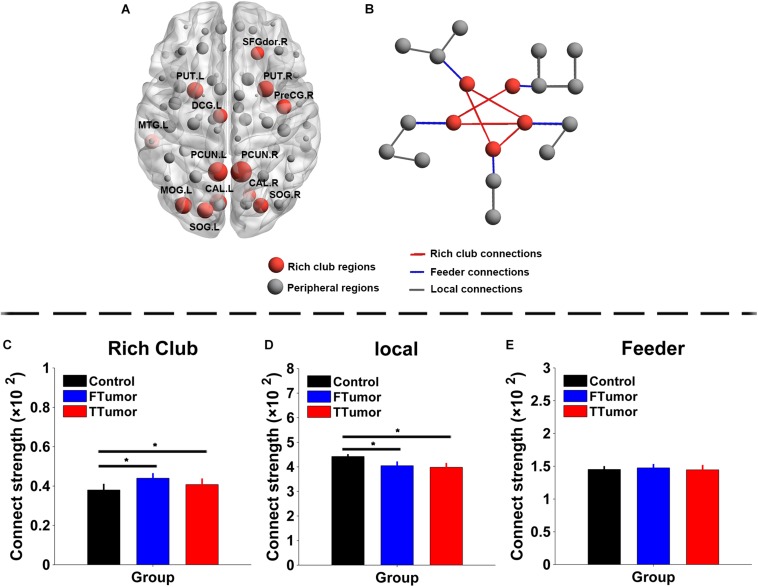
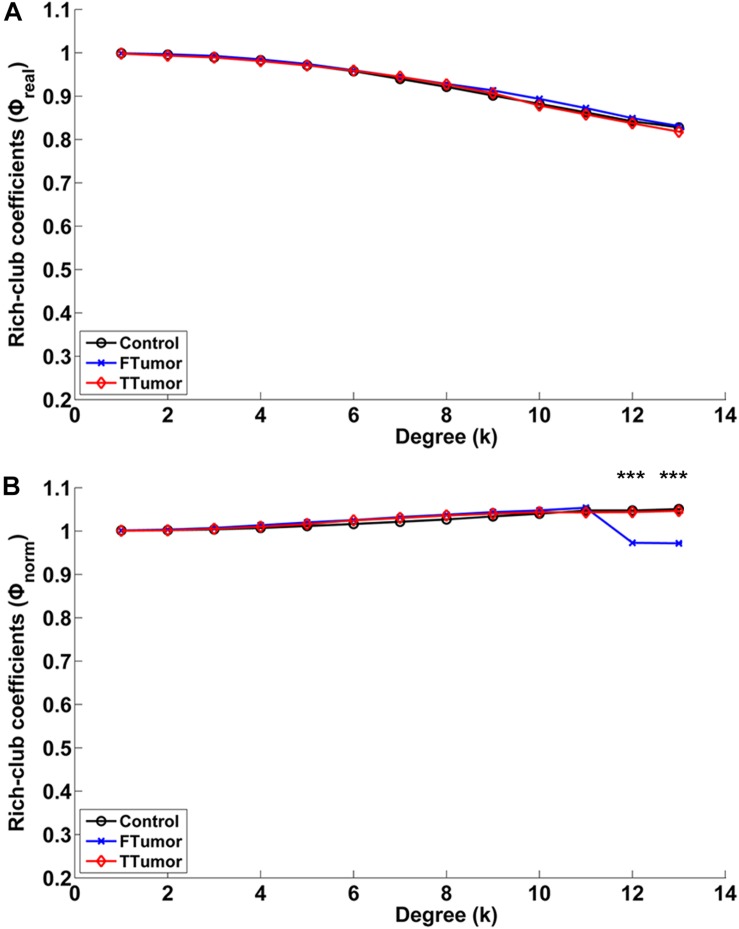
Results: When compared with CN, both FTumor and TTumor showed no alterations in small-world properties and global network efficiency, but instead showed altered local network efficiency. Second, FTumor and TTumor patients showed similar deficits in the nodal shortest path in the left rolandic operculum and degree centrality (DC) of the right dorsolateral and medial superior frontal gyrus (SFGmed). Third, compared to FTumor patients, TTumor patients showed a significantly higher DC in the right dorsolateral and SFGmed, a higher level of betweenness in the right SFGmed, and higher nodal efficiency in the left middle frontal gyrus and right SFGmed. Finally, rich-club organization was disrupted, with increased structural connectivity among rich-club nodes and reduced structural connectivity among peripheral nodes in FTumor and TTumor patients. Altered local efficiency in TTumor correlated with memory function, while altered local efficiency in FTumor correlated with the information processing speed.

Conclusion: Both FTumor and TTumor presented an intact global topology and altered regional topology related to cognitive impairment and may also share the convergent and divergent regional topological organization of WM structural networks. This suggested that a compensatory mechanism plays a key role in global topology formation in both FTumor and TTumor patients, and as such, development of a structural connectome for patients with brain tumors would be an invaluable medical resource and allow clinicians to make comprehensive preoperative planning.

Keywords: cognitive impairment; frontal tumors; rich-club organization; structural network; temporal tumors; topological organization.


Figures

FIGURE 1
FIGURE 1
A symmetric 90 × 90 matrix representing the mean FA-weighted structural network for all participants. (A) indicating the mean FA-weighted structural network for CN; (B) indicating the mean FA-weighted structural network for FTumors; (C) indicating the mean FA-weighted structural network for TTumors.
FIGURE 2
FIGURE 2
Comparison of each cognitive domain between control subjects and patients with frontal and temporal tumors. FTumors, frontal tumors; TTumors, temporal tumors; DST, digit span test; Mem, memory test; VST, visuospatial test; DSST, Digital Symbol Substitution Test; mapping, picture completion test (this test is mainly performed to measure visual memory, visual recognition, and the ability to distinguish between the main characteristics and unimportant details); similarity, similarity test (this test is mainly performed to measure logical thinking ability, abstract thinking ability, and generalization ability). **p < 0.01, ***p < 0.001.
FIGURE 3
FIGURE 3
Small-world property parameters of WM structural networks across the sparsity among the control, FTumors, and TTumors. FTumors, frontal tumors; TTumors, temporal tumors; WM, white matter. (A) indicating comparison of clustering coefficient parameter among three groups; (B) indicating comparison of characteristic path length parameter among three groups; (C) indicating comparison of gamma parameter among three groups; (D) indicating comparison of lambda parameter among three groups; (E) indicating comparison of sigma parameter among three groups.
FIGURE 4
FIGURE 4
Global and local efficiencies of WM structural networks across the sparsity among the control, FTumors, and TTumors. FTumors, frontal tumors; TTumors, temporal tumors; WM, white matter. (A) indicating comparison of local efficiency among three groups; (B) indicating comparison of global efficiency among three groups.
FIGURE 5
FIGURE 5
Brain regions showing abnormal regional nodal characteristics of white matter structural networks. (A) Differences on the nodal shortest path of the WM structural network; (B) differences on the degree centrality of WM structural network; (C) differences on the betweenness centrality of WM structural network; (D) differences on the nodal efficiency of WM structural network among CN, FTumor, and TTumor patients. FTumors, frontal tumors; TTumors, temporal tumors; WM, white matter; NLp, nodal shortest path; DC, degree centrality; BC, betweenness centrality; NE, nodal efficiency; ROL.L, left rolandic operculum; SFGdor.R, right superior frontal gyrus, dorsolateral. SFGmed.R, right superior frontal gyrus, medial; MFG.L, left middle frontal gyrus; AUC, area under the curve. ***p < 0.005.
FIGURE 6
FIGURE 6
Rich-club regions and rich-club organization of WM structural networks. (A) Brain red nodes showing rich club members across all subjects (both healthy and patients). (B) A simplified example of the three classes of connections. Red lines represent rich-club connections linking two rich-club nodes, blue lines represent feeder connections linking one rich-club node to one peripheral node, and gray lines represent local connections linking two peripheral nodes. (C–E) Bar graphs display the mean (standard error) age-, gender-, and education level-adjusted connectivity strengths for rich club, feeder, and (C) local. FTumors, frontal tumors; TTumors, temporal tumors; WM, white matter; NLp, nodal shortest path; DC, degree centrality; BC, betweenness centrality; NE, nodal efficiency; ROL.L, left rolandic operculum; SFGdor.R, right superior frontal gyrus, dorsolateral. SFGmed.R, right superior frontal gyrus, medial; MFG.L, left middle frontal gyrus; AUC, area under the curve. *p < 0.05.
FIGURE 7
FIGURE 7
Relationships between rich-club coefficients (real and normalized) and node degrees (K) of WM structural networks. (A) Real rich-club coefficients and (B) normalized rich-club coefficients for a range of Ks in three groups (node degrees = 13). A rich-club organization phenomenon is considered when normalized rich-club coefficients were larger than 1. FTumors, frontal tumors; TTumors, temporal tumors; WM, white matter. ***P < 0.005.

References

    1. Achard S., Salvador R., Whitcher B., Suckling J., Bullmore E. (2006). A resilient, low-frequency, small-world human brain functional network with highly connected association cortical hubs. J. Neurosci. 26 63–72. 10.1523/jneurosci.3874-05.2006 - DOI - PMC - PubMed
    1. Bai F., Shu N., Yuan Y., Shi Y., Yu H., Wu D., et al. (2012). Topologically convergent and divergent structural connectivity patterns between patients with remitted geriatric depression and amnestic mild cognitive impairment. J. Neurosci. 32 4307–4318. 10.1523/JNEUROSCI.5061-11.2012 - DOI - PMC - PubMed
    1. Bartolomei F., Bosma I., Klein M., Baayen J. C., Reijneveld J. C., Postma T. J., et al. (2006a). Disturbed functional connectivity in brain tumour patients: evaluation by graph analysis of synchronization matrices. Clin. Neurophysiol. 117 2039–2049. 10.1016/j.clinph.2006.05.018 - DOI - PubMed
    1. Bartolomei F., Bosma I., Klein M., Baayen J. C., Reijneveld J. C., Postma T. J., et al. (2006b). How do brain tumors alter functional connectivity? A magnetoencephalography study. Ann. Neurol. 59 128–138. 10.1002/ana.20710 - DOI - PubMed
    1. Bhardwaj R. D., Mahmoodabadi S. Z., Otsubo H., Snead O. C., III, Rutka J. T., Widjaja E. (2010). Diffusion tensor tractography detection of functional pathway for the spread of epileptiform activity between temporal lobe and Rolandic region. Childs Nerv. Syst. 26 185–190. 10.1007/s00381-009-1017-1 - DOI - PubMed

LinkOut - more resources