

Whole-Transcriptome Analysis Unveils the Synchronized Activities of Genes for Fructans in Developing Tubers of the Jerusalem Artichoke
- PMID: 32153609
- PMCID: PMC7046554
- DOI: 10.3389/fpls.2020.00101
Whole-Transcriptome Analysis Unveils the Synchronized Activities of Genes for Fructans in Developing Tubers of the Jerusalem Artichoke
Abstract
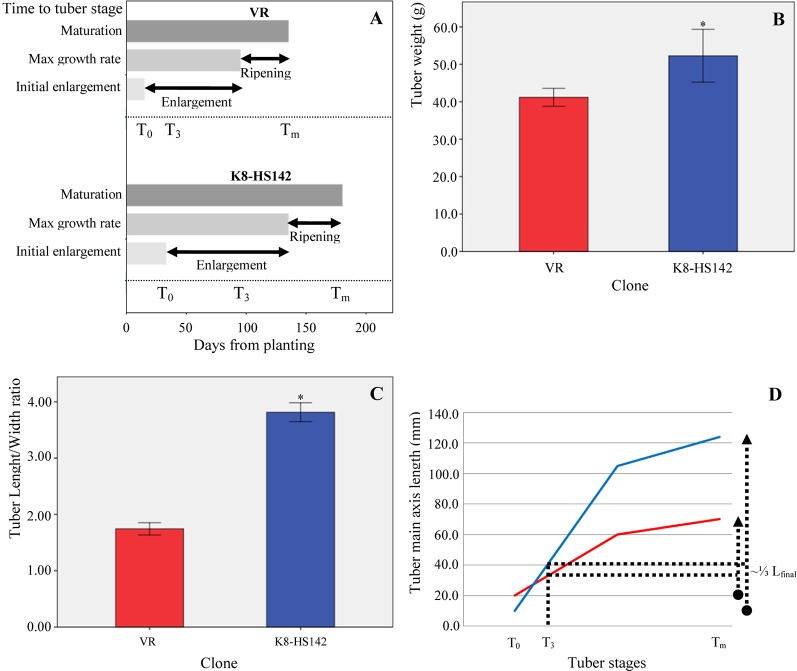
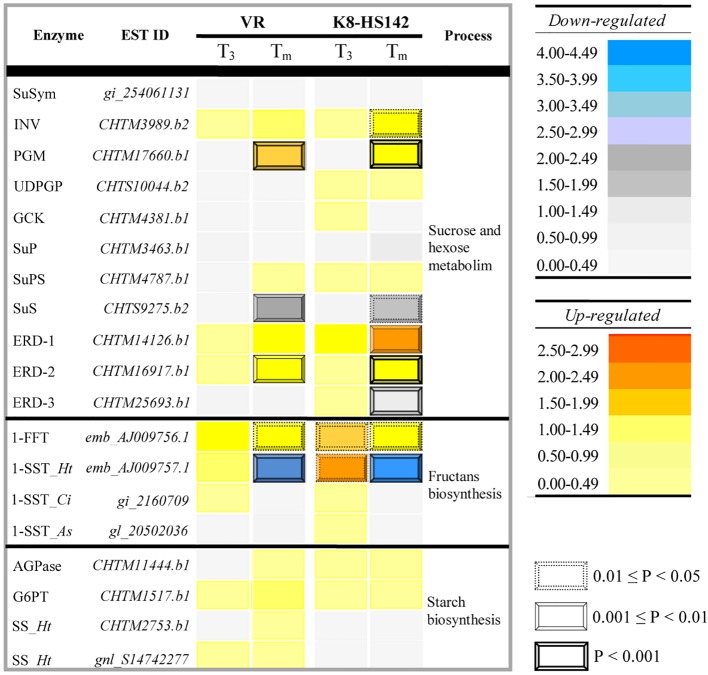
Helianthus tuberosus L., known as the Jerusalem artichoke, is a hexaploid plant species, adapted to low-nutrient soils, that accumulates high levels of inulin in its tubers. Inulin is a fructose-based polysaccharide used either as dietary fiber or for the production of bioethanol. Key enzymes involved in inulin biosynthesis are well known. However, the gene networks underpinning tuber development and inulin accumulation in H. tuberous remain elusive. To fill this gap, we selected 6,365 expressed sequence tags (ESTs) from an H. tuberosus library to set up a microarray platform and record their expression across three tuber developmental stages, when rhizomes start enlarging (T0), at maximum tuber elongation rate (T3), and at tuber physiological maturity (Tm), in "VR" and "K8-HS142"clones. The former was selected as an early tuberizing and the latter as a late-tuberizing clone. We quantified inulin and starch levels, and qRT-PCR confirmed the expression of critical genes accounting for inulin biosynthesis. The microarray analysis revealed that the differences in morphological and physiological traits between tubers of the two clones are genetically determined since T0 and that is relatively low the number of differentially expressed ESTs across the stages shared between the clones (93). The expression of ESTs for sucrose:sucrose 1-fructosyltransferase (1-SST) and fructan:fructan 1-fructosyltransferase (1-FFT), the two critical genes for fructans polymerization, resulted to be temporarily synchronized and mirror the progress of inulin accumulation and stretching. The expression of ESTs for starch biosynthesis was insignificant throughout the developmental stages of the clones in line with the negligible level of starch into their mature tubers, where inulin was the dominant polysaccharide. Overall, our study disclosed candidate genes underpinning the development and storage of carbohydrates in the tubers of two H. tuberosus clones. A model according to which the steady-state levels of 1-SST and 1-FFT transcripts are developmentally controlled and might represent a limiting factor for inulin accumulation has been provided. Our finding may have significant repercussions for breeding clones with improved levels of inulin for food and chemical industry.
Keywords: Helianthus tuberosus; expressed sequence tags; fructosyltransferases; inulin; microarray; qRT-PCR; tuber phenology.
Copyright © 2020 Bizzarri, Delledonne, Ferrarini, Tononi, Zago, Vittori, Damiani and Paolocci.
Figures


Similar articles
-
Cloning of the fructan biosynthesis pathway of Jerusalem artichoke.Plant J. 1998 Aug;15(4):489-500. doi: 10.1046/j.1365-313x.1998.00230.x. Plant J. 1998. PMID: 9753774
-
Fructan:fructan 1-fructosyltransferase and inulin hydrolase activities relating to inulin and soluble sugars in Jerusalem artichoke (Helianthus tuberosus Linn.) tubers during storage.J Food Sci Technol. 2017 Mar;54(3):698-706. doi: 10.1007/s13197-017-2508-9. Epub 2017 Feb 14. J Food Sci Technol. 2017. PMID: 28298683 Free PMC article.
-
Characterization of Fructan Metabolism During Jerusalem Artichoke (Helianthus tuberosus L.) Germination.Front Plant Sci. 2018 Sep 19;9:1384. doi: 10.3389/fpls.2018.01384. eCollection 2018. Front Plant Sci. 2018. PMID: 30283489 Free PMC article.
-
Preparation of high-fructose syrup from the tubers of the Jerusalem artichoke (Helianthus tuberosus L.CRC Crit Rev Food Sci Nutr. 1979 Nov;12(1):1-28. doi: 10.1080/10408397909527271. CRC Crit Rev Food Sci Nutr. 1979. PMID: 41685 Review.
-
Exploring the Therapeutic Potential, Ethnomedicinal Values, and Phytochemistry of Helianthus tuberosus L.: A Review.Pharmaceuticals (Basel). 2024 Dec 11;17(12):1672. doi: 10.3390/ph17121672. Pharmaceuticals (Basel). 2024. PMID: 39770513 Free PMC article. Review.
Cited by
-
Light and Temperature Shape the Phenylpropanoid Profile of Azolla filiculoides Fronds.Front Plant Sci. 2021 Oct 21;12:727667. doi: 10.3389/fpls.2021.727667. eCollection 2021. Front Plant Sci. 2021. PMID: 34745161 Free PMC article.
-
Functional Characterization of MtrGSTF7, a Glutathione S-Transferase Essential for Anthocyanin Accumulation in Medicago truncatula.Plants (Basel). 2022 May 16;11(10):1318. doi: 10.3390/plants11101318. Plants (Basel). 2022. PMID: 35631744 Free PMC article.
-
A Fructan Exohydrolase from Maize Degrades Both Inulin and Levan and Co-Exists with 1-Kestotriose in Maize.Int J Mol Sci. 2021 May 13;22(10):5149. doi: 10.3390/ijms22105149. Int J Mol Sci. 2021. PMID: 34068004 Free PMC article.
-
Impact of High Light Intensity and Low Temperature on the Growth and Phenylpropanoid Profile of Azolla filiculoides.Int J Mol Sci. 2023 May 10;24(10):8554. doi: 10.3390/ijms24108554. Int J Mol Sci. 2023. PMID: 37239901 Free PMC article.
References
-
- Altenbach D., Ritsema T. (2007). Structure-function relations and evolution of fructosyltransferases. Res. Signpost 37 (661).
LinkOut - more resources
Full Text Sources
Molecular Biology Databases
Research Materials
Miscellaneous