. 2020 Feb 21:11:45.
doi: 10.3389/fgene.2020.00045. eCollection 2020.

Identification of Core Gene Expression Signature and Key Pathways in Colorectal Cancer

Affiliations

Identification of Core Gene Expression Signature and Key Pathways in Colorectal Cancer

Xiang Ding et al. Front Genet. .

Abstract

Objective: Colorectal cancer (CRC) is considered the most prevalent malignant tumor that contributes to high cancer-related mortality. However, the signaling pathways involved in CRC and CRC-driven genes are largely unknown. We sought to discover a novel biomarker in CRC.

Materials and methods: All clinical CRC samples (n = 20) were from Renmin Hospital of Wuhan University. We first selected MAD2L1 by integrated bioinformatics analysis of a GSE dataset. Next, the expression of MAD2L1 in tissues and cell lines was verified by quantitative real-time PCR. The effects of MAD2L1 on cell growth, proliferation, the cell cycle, and apoptosis were examined by in vitro assays.

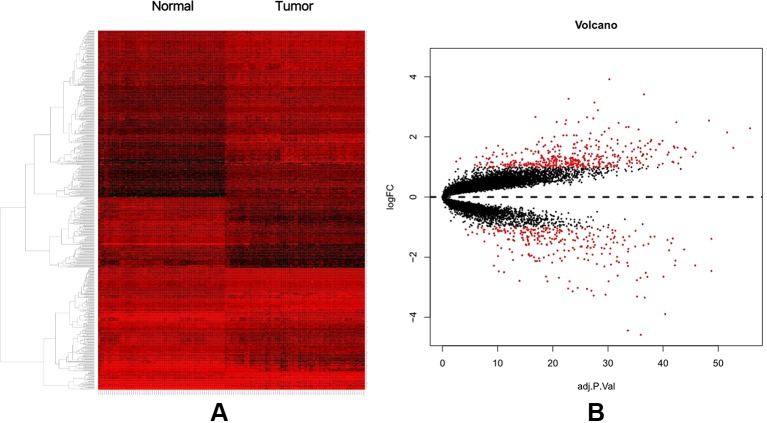
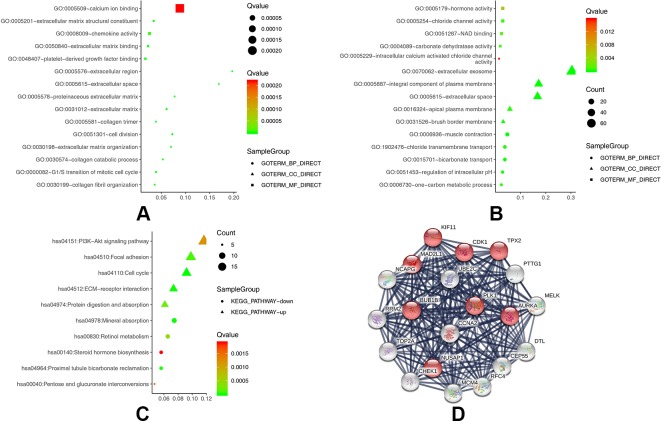
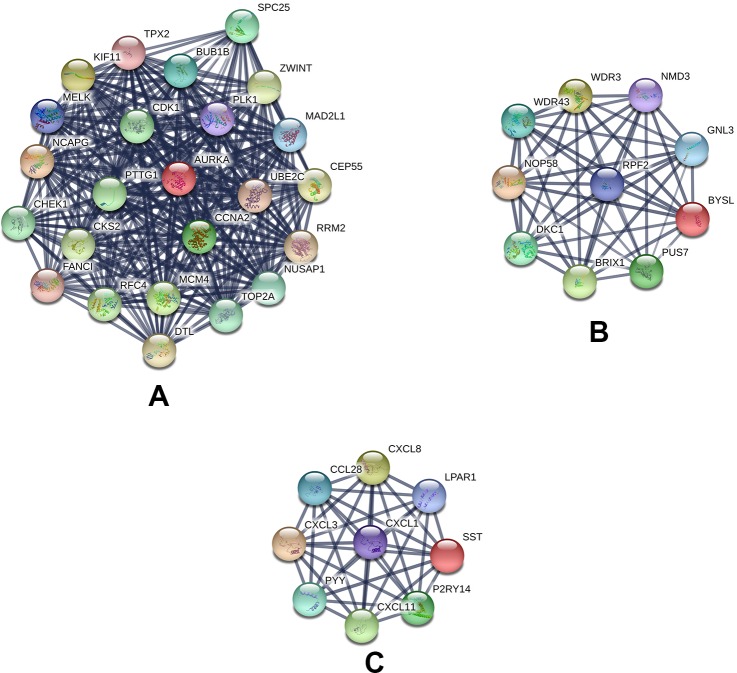
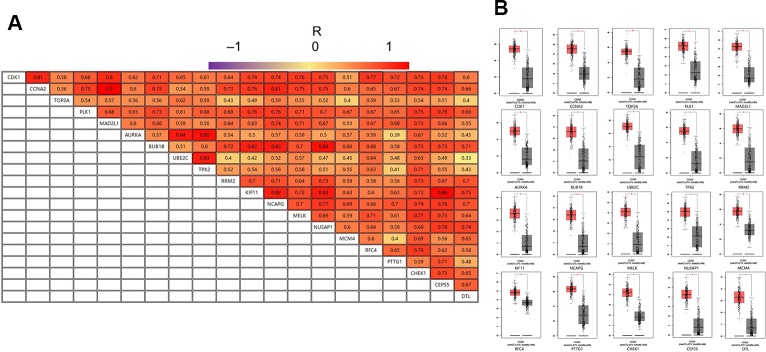
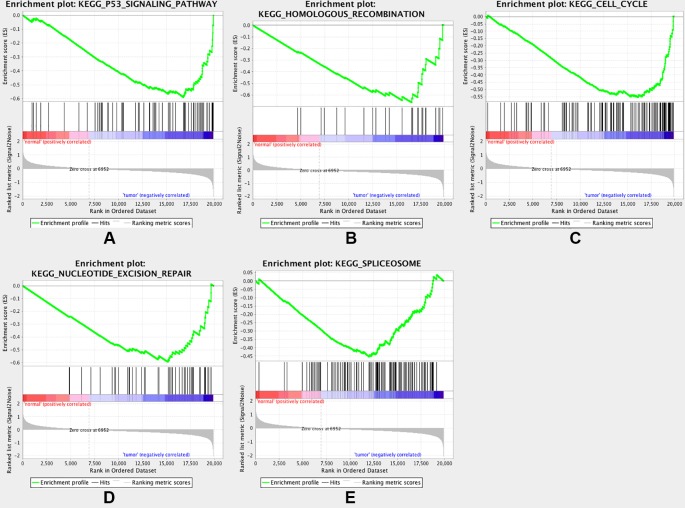
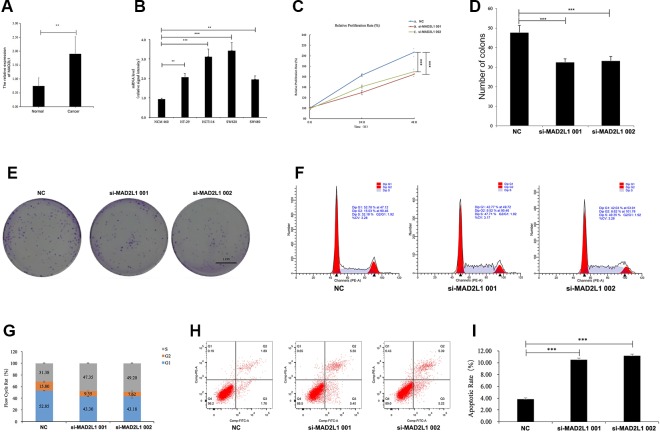
Results: We identified 683 shared DEGs (420 upregulated and 263 downregulated), and the top twenty genes (CDK1, CCNA2, TOP2A, PLK1, MAD2L1, AURKA, BUB1B, UBE2C, TPX2, RRM2, KIF11, NCAPG, MELK, NUSAP1, MCM4, RFC4, PTTG1, CHEK1, CEP55, DTL) were selected by integrated analysis. These hub genes were significantly overexpressed in CRC samples and were positively correlated. Our data revealed that the expression of MAD2L1 in CRC tissues is higher than that in normal tissues. MAD2L1 knockdown significantly suppressed CRC cell growth by impairing cell cycle progression and inducing cell apoptosis.

Conclusion: MAD2L1, as a novel oncogenic gene, plays a role in regulating cancer cell growth and apoptosis and could be used as a new biomarker for diagnosis and therapy in CRC.

Keywords: MAD2L1; apoptosis; bioinformatics analysis; cell cycle; colorectal cancer; proliferation.


Figures

Figure 1
Figure 1
(A) Heat map of DEGs. (B) Volcano plot of genes detected in CRC. Red means upregulated and downregulated DEGs; black means no difference.
Figure 2
Figure 2
(A) GO analysis of upregulated DEGs. (B) GO analysis of downregulated DEGs. (C) KEGG pathway of DEGs. (D) The protein–protein interaction (PPI) network of the top 20 hub genes.
Figure 3
Figure 3
Top 3 modules from the protein–protein interaction network: (A) module 1, (B) module 2, (C) module 3.
Figure 4
Figure 4
(A) The correlation analysis of the 20 hub genes. (B) Expression levels of the 20 hub genes in CRC compared to the normal samples. Notes: R is the Pearson correlation coefficient. Abbreviations: CRC, colorectal cancer.
Figure 5
Figure 5
Gene set enrichment analysis (GSEA). Listed pictures are five representative functional gene sets enriched in CRC with MAD2L1 highly expressed.
Figure 6
Figure 6
MAD2L1 knockdown suppressed colon cancer cell proliferation by impairing cell cycle progression and inducing apoptosis. Notes: (A) Expression level of MAD2L1 gene in 20 paired CRC tissues (n = 3; **P < 0.01; two-tailed t-test). (B) Expression level of MAD2L1 gene in colon normal cell line NCM460 and CRC cell line HT-29, HCT116, SW620 and SW480 (n = 3; **P < 0.01, ***P < 0.001; two-tailed t-test). (C) The cell proliferation rate was analyzed by CCK-8 assay. All value were mean ± SD (n = 3; ***P < 0.001; two-tailed t-test). (D), (E) Colony formation assays were performed (n = 3; ***P < 0.001; two-tailed t-test). (F, G) Distribution of cells in three cell cycle phases was examined by flow cytometry assay, and the graph shows quantification for each phase. (H) For measurement of apoptotic cells, cells were stained with both AV and PI and analyzed by an image flow assay. (I) Graph illustrating the quantification of apoptotic cells (n = 3; ***P < 0.001; two-tailed t-test). Abbreviations: AV, Annexin V FITC; CCK-8, cell counting kit-8, PI, propidium iodide; NC, negative control.

References

    1. Altman N. S. (1992). An introduction to kernel and nearest-neighbor nonparametric regression. Am. Stat. 46, 175–185. 10.1080/00031305.1992.10475879 - DOI
    1. Aran V., Victorino A. P., Thuler L. C., Ferreira C. G. (2016). Colorectal cancer: epidemiology, disease mechanisms and interventions to reduce onset and mortality. Clin. Colorectal Cancer 15, 195–203. 10.1016/j.clcc.2016.02.008 - DOI - PubMed
    1. Baraniskin A., Birkenkamp-Demtroder K., Maghnouj A., Zollner H., Munding J., Klein-Scory S., et al. (2012). MiR-30a-5p suppresses tumor growth in colon carcinoma by targeting DTL. Carcinogenesis 33, 732–739. 10.1093/carcin/bgs020 - DOI - PubMed
    1. Bofin A. M., Ytterhus B., Hagmar B. M. (2003). TOP2A and HER-2 gene amplification in fine needle aspirates from breast carcinomas. Cytopathology 14, 314–319. 10.1046/j.0956-5507.2003.00088.x - DOI - PubMed
    1. Bolstad B. M., Irizarry R. A., Astrand M., Speed T. P. (2003). A comparison of normalization methods for high density oligonucleotide array data based on variance and bias. Bioinformatics 19, 185–193. 10.1093/bioinformatics/19.2.185 - DOI - PubMed