. 2020 Feb 20:10:160.
doi: 10.3389/fonc.2020.00160. eCollection 2020.

Long Non-coding RNA MIR4435-2HG Promotes Colorectal Cancer Proliferation and Metastasis Through miR-206/YAP1 Axis

Affiliations

Long Non-coding RNA MIR4435-2HG Promotes Colorectal Cancer Proliferation and Metastasis Through miR-206/YAP1 Axis

Xinhua Dong et al. Front Oncol. .

Abstract

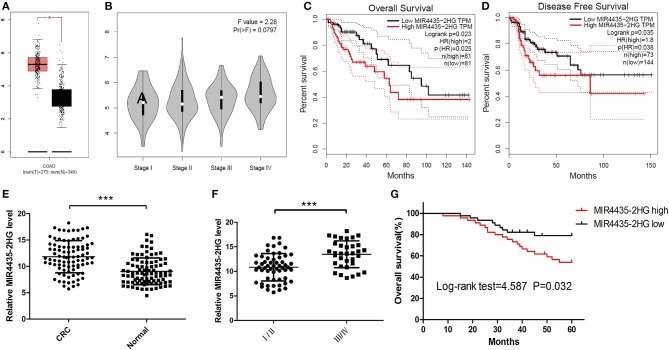
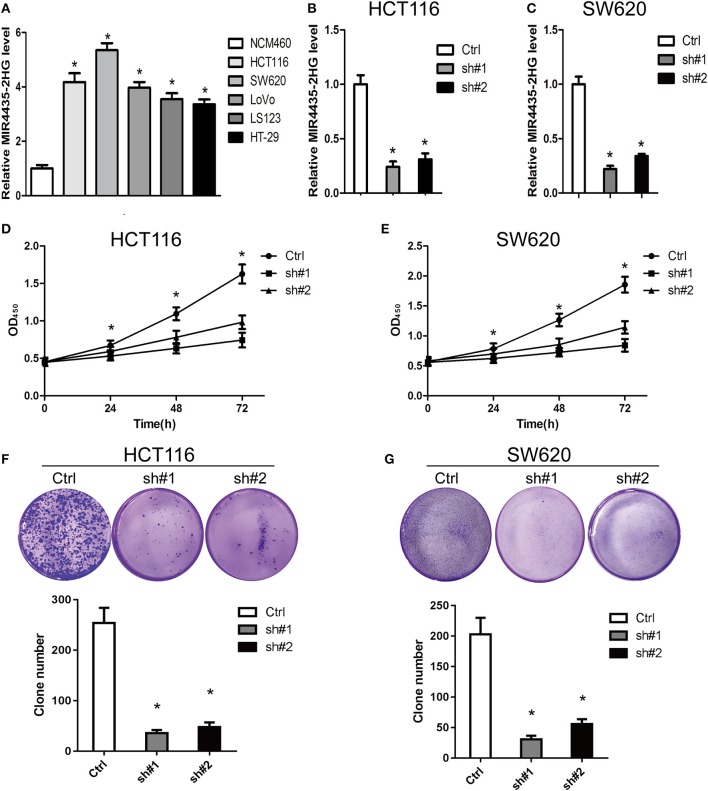
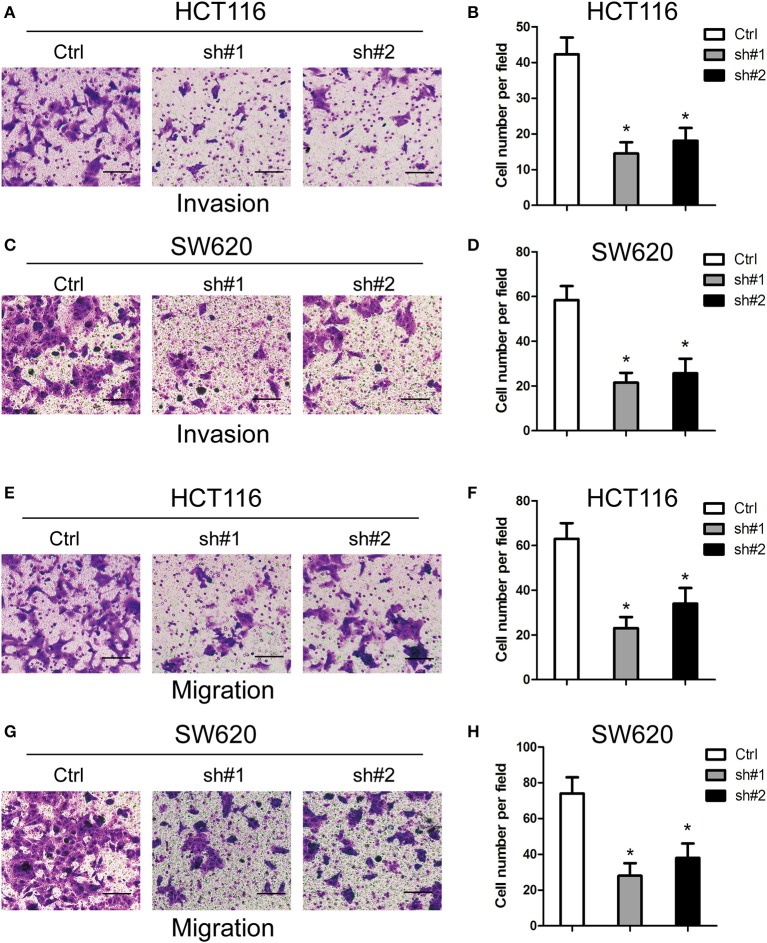
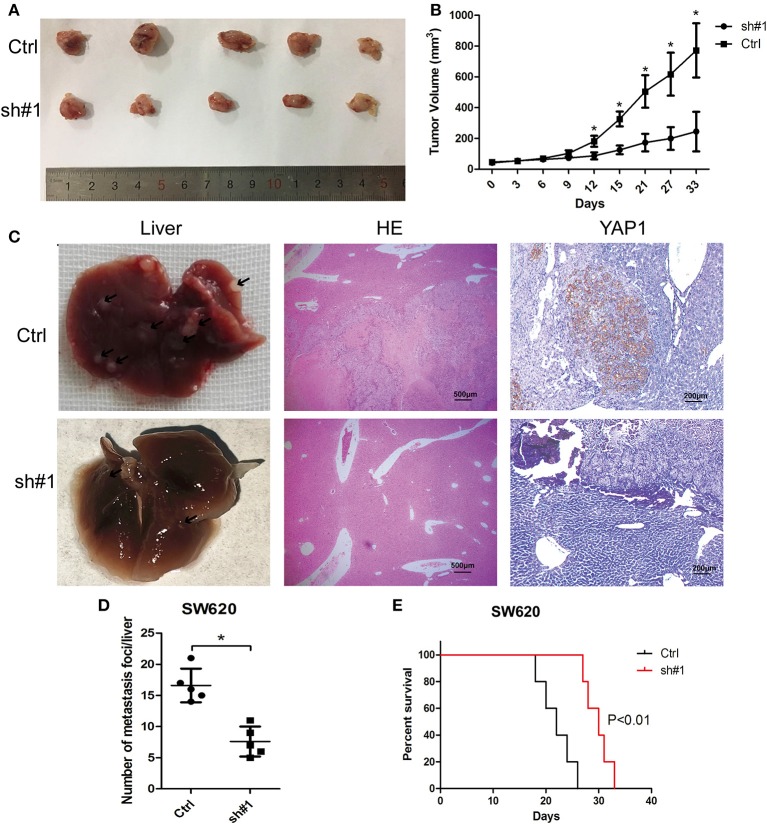
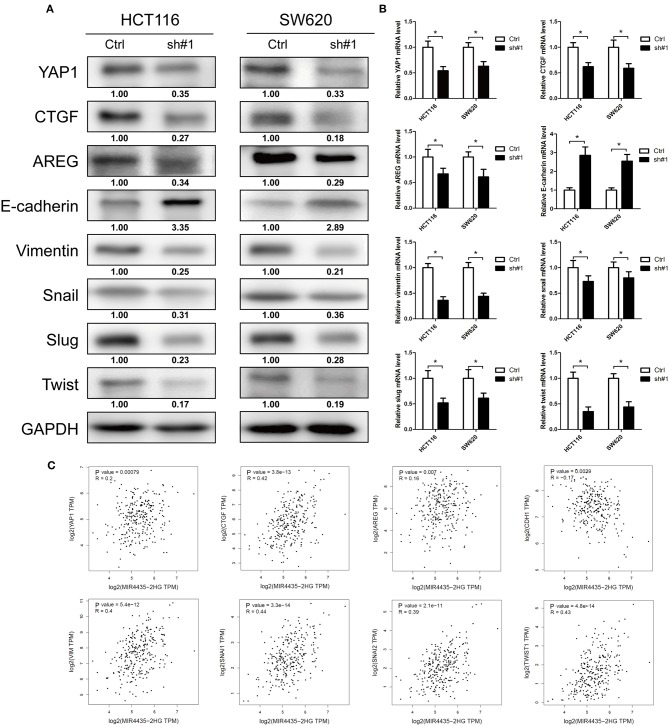
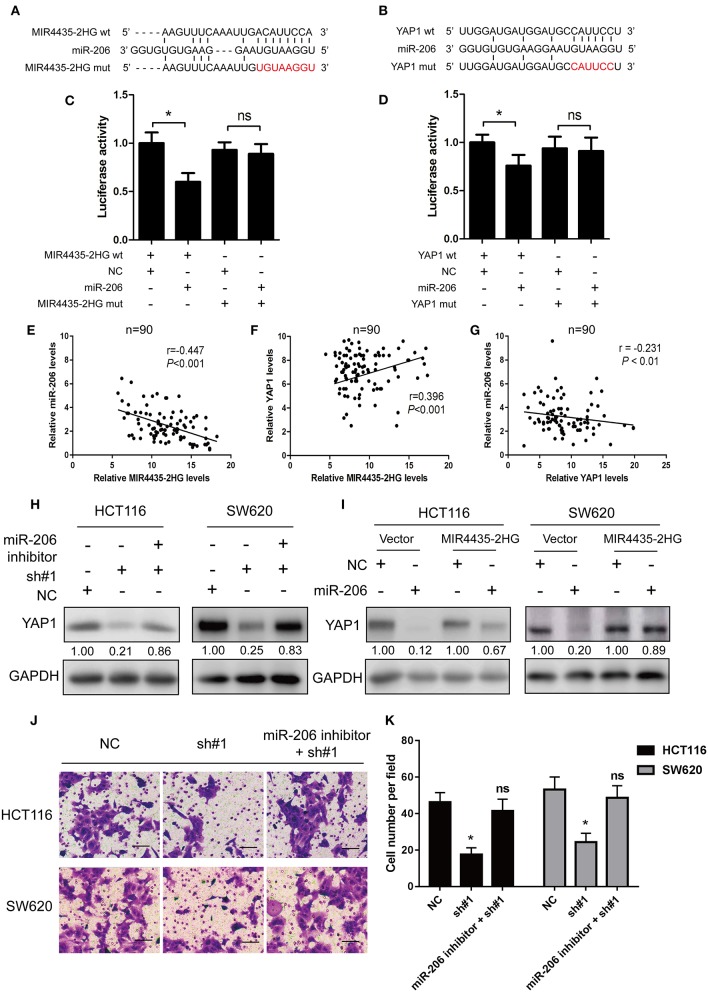
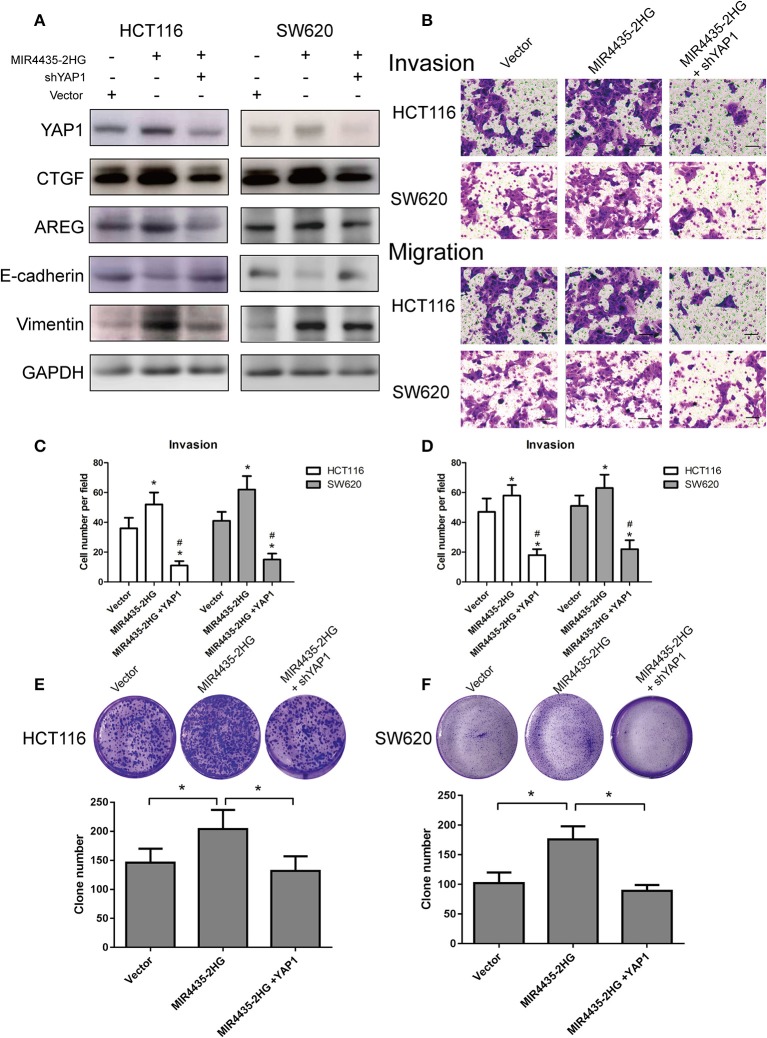
Objective: Long non-coding RNAs (lncRNAs) are critical to colorectal cancer (CRC) progression. In the current study, the objective was the exploration of the role played by lncRNA MIR4435-2HG in CRC proliferation and metastasis. Methods: lncRNA MIR4435-2HG expression and its association with CRC were analyzed using database and clinical specimens. The influences exerted by MIR4435-2HG on cell proliferating process, invading process, and migrating process of CRC were identified after MIR4435-2HG knockdown. The influences exerted by MIR4435-2HG on tumor growth and metastasis were assessed in vivo. The underlying mechanistic associations between MIR4435-2HG, microRNA miR-206, and the transcription factor Yes-associated protein 1 (YAP1) were assessed using bioinformatics and a luciferase reporter gene assay. Results: MIR4435-2HG was highly expressed in CRC tissue in contrast with that in regular tissues and displayed relations to poor prognosis. MIR4435-2HG knockdown could suppress CRC cell proliferation, invasion, and migration. Moreover, MIR4435-2HG knockdown inhibited CRC growth and liver metastasis in vitro. We found MIR4435-2HG knockdown reduced YAP1, CTGF, AREG, vimentin, Snail, Slug, and Twist expression but enhanced E-cadherin expression. Functionally, MIR4435-2HG acted as a competing endogenous RNA (ceRNA) to upregulate YAP1 by sponging miR-206. Conclusions: MIR4435-2HG promoted CRC growth and metastasis through miR-206/YAP1 axis and is likely to play prognostic marker roles and be therapeutically targeted in CRC.

Keywords: MIR4435-2HG; YAP1; colorectal cancer; long non-coding RNA; metastasis; proliferation.


Figures

Figure 1
Figure 1
The expression and prognosis of long non-coding RNA (lncRNA) MIR4435-2HG of colorectal cancer (CRC) in The Cancer Genome Atlas (TCGA) database and clinical specimens. (A) Gene Expression Profiling Interactive Analysis (GEPIA) of CRC data in TCGA show lncRNA MIR4435-2HG's expression state in colon adenocarcinoma (COAD) and normal tissue. (B) The lncRNA MIR4435-2HG expression levels at different stages of COAD. (C,D) The impact of different expression levels of lncRNA MIR4435-2HG in overall survival and disease-free survival in COAD. (E) Comparison of lncRNA MIR4435-2HG in CRC tissues (n = 45) and normal tissues (n = 90). (F) LncRNA MIR4435-2HG expression at different TNM stages of CRC. (G) Kaplan Meier survival estimates of the correlations between lncRNA MIR4435-2HG expression and general survival of 90 cases with CRC shown in (E). *P < 0.05, ***P < 0.001.
Figure 2
Figure 2
Knockdown of MIR4435-2HG inhibited growth and proliferating process of colorectal cancer (CRC) cells. (A) Expression analysis of MIR4435-2HG in CRC cell lines. (B,C) MIR4435-2HG expression was reduced by using two short hairpin RNAs (shRNAs) targeting MIR4435-2HG in HCT116 and SW620 cell lines. *P < 0.05; n = 3. (D,E) The effect of proliferation inhibition by MIR4435-2HG knockdown in HCT116 and SW620 cells in contrast to that in their respective controls was analyzed using a CCK8 assay. *P < 0.05; n = 3. (F,G) Colony formation assays were performed to evaluate cell growth following MIR4435-2HG knockdown in HCT116 and SW620 cells. *P < 0.05; n = 3.
Figure 3
Figure 3
Effects of MIR4435-2HG on colorectal cancer (CRC) cells' invading and migrating processes in vitro. (A–D) Invasive potential of MIR4435-2HG knockdown in HCT116 and SW620 cells compared with that in their respective controls was analyzed using a Transwell invasion assay. *P < 0.05; n = 3. (E–H) Migratory potential of MIR4435-2HG knockdown in HCT116 and SW620 cells compared with their respective controls analyzed using a Transwell migration assay. *P < 0.05; n = 3.
Figure 4
Figure 4
MIR4435-2HG silencing inhibited colorectal cancer (CRC) growth and metastasis in vivo. (A,B) SW620 cells where MIR4435-2HG was stably knocked down of were subcutaneously transplanted into BALB/c nude mice in a xenograft model (n = 5 mice per group). Two-tailed Student's t-test. Tumor volumes were monitored at the suggested time points in the control (Ctrl) and experimental (sh#1) groups. (C) Representative livers from the orthotopic mouse model of CRC, hematoxylin and eosin-stained images and immunohistochemical stained images of YAP1 show metastatic lesions and the YAP1 expression in the livers. (D) Mean ± SD. *P < 0.05 denotes the number of metastatic nodules in the livers; using two-tailed Student's t-test; n = 5. (E) Overall survival curve of mice from the orthotopic model of CRC according to the MIR4435-2HG expression (n = 5).
Figure 5
Figure 5
Downregulation of MIR4435-2HG inhibited tumor growth and epithelial-mesenchymal transition (EMT) via the Hippo signaling pathway. (A) Western blotting results show decreased protein levels of YAP1 following the knockdown of MIR4435-2HG in HCT116 and SW620 cells. Tumor growth markers CTGF and AREG expression levels were decreased after knockdown MIR4435-2HG in HCT116 and SW620 cells. Protein expression levels of mesenchymal markers vimentin, Snail, Slug, and Twist were down-regulated, and epithelial marker E-cadherin expression was increased after knockdown of MIR4435-2HG in HCT116 and SW620 cells. (B) Levels of YAP1, CTGF, AREG, E-cadherin, vimentin, Snail, Slug, and Twist mRNAs were measured by real-time reverse transcription polymerase chain reaction (RT-PCR). (C) Correlation of MIR4435-2HG with YAP1, CTGF, AREG, E-cadherin, vimentin, Snail, Slug, and Twist according to Gene Expression Profiling Interactive Analysis (GEPIA) of colorectal cancer (CRC) data in The Cancer Genome Atlas (TCGA) database. *P < 0.05.
Figure 6
Figure 6
MIR4435-2HG was a molecular sponge for miR-206 and controlled the miR-206 target YAP1. (A) Predicted sequences of miR-206-binding sites within MIR4435-2HG. MIR4435-2HG wt, miR-206, and MIR4435-2HG mutants (mut) sequences were used in Luciferase reporter gene assays. (B) Estimated sequences of miR-206-binding sites within the 3′-UTRs of YAP1 and sequences of YAP1 and YAP1 3′-UTR mutants (mut) were adopted here. (C) Luciferase reporter gene assays were adopted for assessing the interaction between miR-206 and MIR4435-2HG in SW620 cells. (D) Luciferase activity in SW620 cells underwent co-transfection with miR-206 mimics and luciferase reporters containing wild-type YAP1 or mutated 3′-UTR-driven reporter constructs. (E–G) Correlation between MIR4435-2HG, miR-206, and YAP1 expression in CRC and normal colon specimens as detecting by real-time PCR (n = 90). (H) Western blotting assay of YAP1 protein expression in YAP1 knockdown in HCT116 and SW620 cells with and without miR-206 inhibitor. (I) Western blot analysis of YAP1 protein expression following expression of empty vector (NC) or MIR4435-2HG and treating process with miRNA negative control or miR-206 mimics. (J,K) The migration ability after MIR4435-2HG knockdown with and without miR-206 inhibitor in HCT116 and SW620 cells. *P < 0.05.
Figure 7
Figure 7
Biological function of MIR4435-2HG is determined by YAP1. (A) Western blotting analysis of the suggested proteins in HCT116 and SW620 cells transfected with a control vector, MIR4435-2HG, or YAP1 short hairpin RNA (shRNA). GAPDH acted as a loading control. (B–D) MIR4435-2HG and YAP1 shRNA vectors underwent the transfection into HCT116 and SW620 cells and cell invasion and migration were detected using Transwell invasion and migration assays. Data are shown as mean ± SD (n = 3). *Compared with vector P < 0.05; #compared with MIR4435-2HG P < 0.05. (E,F) Clone formation assays were used to detect the growth of HCT116 and SW620 cells after transfection with a control vector, MIR4435-2HG, or YAP1 shRNA. Mean ± SD (n = 3) denotes the data. *P < 0.05.

Similar articles

Cited by

References

    1. Siegel RL, Miller KD, Jemal A. Cancer statistics, 2017. CA Cancer J Clin. (2017) 67:7–30. 10.3322/caac.21387 - DOI - PubMed
    1. Procaccio L, Schirripa M, Fassan M, Vecchione L, Bergamo F, Prete AA, et al. . Immunotherapy in gastrointestinal cancers. Biomed Res Int. (2017) 2017:4346576. 10.1155/2017/4346576 - DOI - PMC - PubMed
    1. Pan JH, Zhou H, Cooper L, Huang JL, Zhu SB, Zhao XX, et al. . LAYN Is a prognostic biomarker and correlated with immune infiltrates in gastric and colon cancers. Front Immunol. (2019) 10:6. 10.3389/fimmu.2019.00006 - DOI - PMC - PubMed
    1. Weidle UH, Birzele F, Kollmorgen G, Rüger R. Long non-coding RNAs and their role in metastasis. Cancer Genom Proteomics. (2017) 14:143–60. 10.21873/cgp.20027 - DOI - PMC - PubMed
    1. Yang F, Zhang L, Huo XS, Yuan JH, Xu D, Yuan SX, et al. . Long noncoding RNA high expression in hepatocellular carcinoma facilitates tumor growth through enhancer of zeste homolog 2 in humans. Hepatology. (2011) 54:1679–89. 10.1002/hep.24563 - DOI - PubMed