

Enhancing protective microglial activities with a dual function TREM2 antibody to the stalk region
- PMID: 32154671
- PMCID: PMC7136959
- DOI: 10.15252/emmm.201911227
Enhancing protective microglial activities with a dual function TREM2 antibody to the stalk region
Abstract
Triggering receptor expressed on myeloid cells 2 (TREM2) is essential for the transition of homeostatic microglia to a disease-associated microglial state. To enhance TREM2 activity, we sought to selectively increase the full-length protein on the cell surface via reducing its proteolytic shedding by A Disintegrin And Metalloproteinase (i.e., α-secretase) 10/17. We screened a panel of monoclonal antibodies against TREM2, with the aim to selectively compete for α-secretase-mediated shedding. Monoclonal antibody 4D9, which has a stalk region epitope close to the cleavage site, demonstrated dual mechanisms of action by stabilizing TREM2 on the cell surface and reducing its shedding, and concomitantly activating phospho-SYK signaling. 4D9 stimulated survival of macrophages and increased microglial uptake of myelin debris and amyloid β-peptide in vitro. In vivo target engagement was demonstrated in cerebrospinal fluid, where nearly all soluble TREM2 was 4D9-bound. Moreover, in a mouse model for Alzheimer's disease-related pathology, 4D9 reduced amyloidogenesis, enhanced microglial TREM2 expression, and reduced a homeostatic marker, suggesting a protective function by driving microglia toward a disease-associated state.
Keywords: Alzheimer's disease; TREM2; amyloid β-peptide; microglia; therapeutic antibody.
© 2020 The Authors. Published under the terms of the CC BY 4.0 license.
Conflict of interest statement
C.H. collaborates with Denali Therapeutics, participated on one advisory board meeting of Biogen, and received a speaker honorarium from Novartis and Roche. C.H. is chief advisor of ISAR Bioscience. J.W.L., K.M.M., J.I.P., H.S., J.S., R.P., D.X., C.M., D.J.K., C.C.L., F.H., and G.D.P. are employees of Denali Therapeutics.
Figures
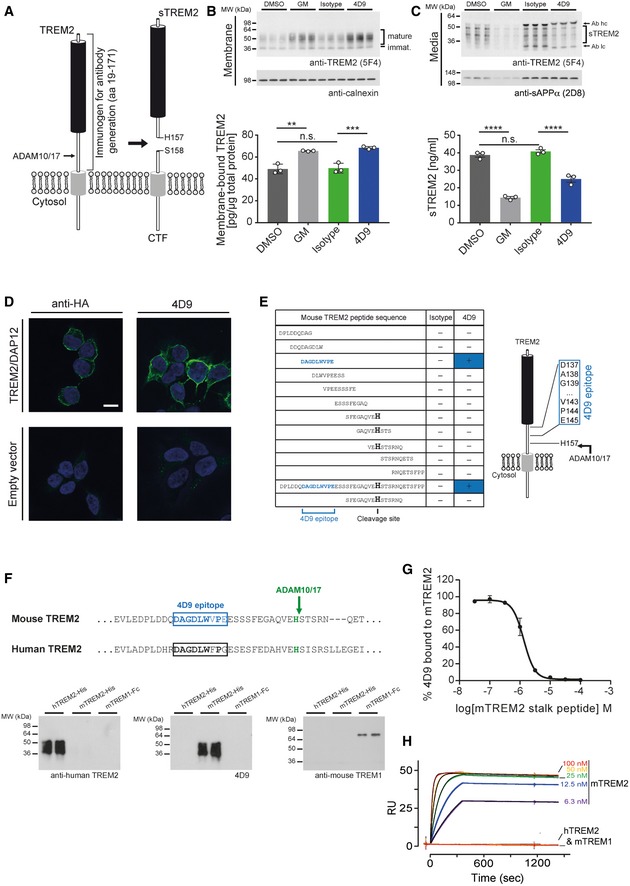
Schematic representation of TREM2 processing by ADAM10/17. Cleavage occurs C‐terminal of residue His 157. The entire ectodomain (residues 19–171) was used for immunization of rats to generate TREM2 antibodies. CTF, C‐terminal fragment; sTREM2, soluble TREM2.
Immunoblot analysis of membrane fractions of HEK293 Flp‐In cells stably overexpressing both mouse TREM2 and mouse DAP12 upon treatment with 4D9 antibody reveals increased levels of membrane‐bound TREM2 similar to what can be achieved by ADAM protease inhibition using the GM6001 inhibitor. An isotype antibody was used as a negative control. Calnexin served as a loading control. Levels of membrane‐bound TREM2 were quantified by MSD ELISA. Data represent the mean ± SEM (n = 3). One‐way ANOVA, Tukey's post hoc test; P (DMSO vs GM) = 0.0011; P (DMSO vs isotype) = 0.992; P (isotype vs 4D9) = 0.0005; n.s., not significant.
Immunoblot analysis of conditioned media from HEK293 Flp‐In cells stably overexpressing both mouse TREM2 and mouse DAP12 upon treatment with 4D9 antibody reveals decreased levels of sTREM2 similar to what can be achieved by ADAM protease inhibition using the GM6001 inhibitor. An isotype antibody was used as a negative control. sAPPα served as a loading control. Note that heavy and light chains of the antibodies used for treatment are also detected and annotated. Levels of sTREM2 were quantified by MSD ELISA. Data represent the mean ± SEM (n = 3). One‐way ANOVA, Tukey's post hoc test; P (DMSO vs GM) < 0.0001; P (DMSO vs isotype) = 0.6372; P (isotype vs 4D9) < 0.0001; n.s., not significant.
4D9 antibody selectively detects TREM2 on the cell surface of HEK293 Flp‐In cells stably overexpressing mouse TREM2 and mouse DAP12. An anti‐HA antibody was used as a positive control, while empty vector‐transfected HEK293 Flp‐In cells were used as a negative control. Scale bar = 10 μm.
Peptide ELISAs detect anti‐mouse TREM2 antibody binding to tiled stalk region peptides, full‐length stalk peptide, or a truncated ADAM cleavage site peptide. The binding epitope of 4D9 antibody is located 12‐amino acids N‐terminal of the ADAM cleavage site at His 157.
Sequence comparison of mouse TREM2 and human TREM2 shows substantial sequence conservation around the 4D9 epitope (upper panel). Immunoblot analysis demonstrates that antibody 4D9 is highly specific for mouse TREM2 and does not detect human TREM2 or mouse TREM1 (lower panel).
4D9 binding to the mouse TREM2 ECD is competed off by a stalk region peptide. A competition ELISA demonstrates that a dose titration of stalk peptide reduces binding of 4D9 to TREM2 ECD with an EC50 of 1.3 μM. Data represent the mean ± SEM (n = 3). ECD, extracellular domain.
Surface plasmon resonance binding kinetics of increasing concentrations of 4D9 antibody to mouse TREM2 ECD evaluated by Biacore, k on = 5.9 × 10⁵ M−1 s−1, k off = 4.0 × 10⁻⁵ s−1, K D = 68 pM. 4D9 binding to human TREM2 or mouse TREM1 was undetectable.
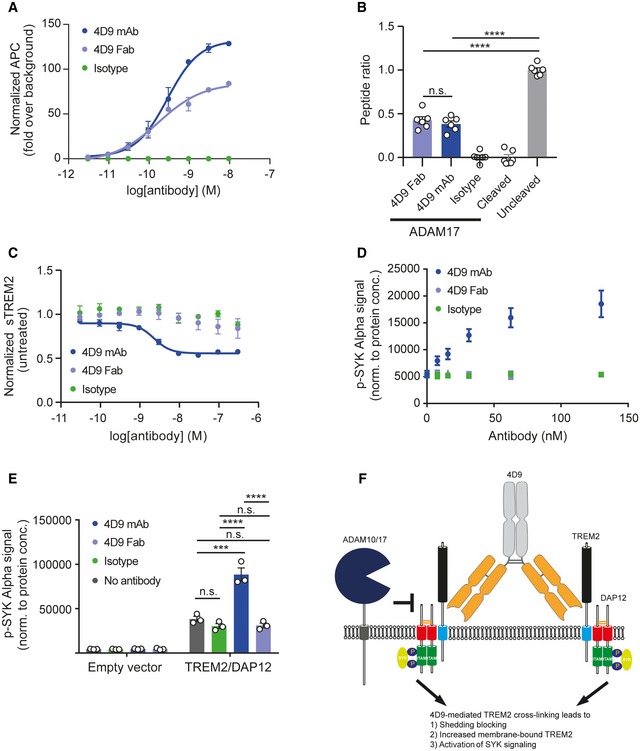
Flow cytometry dose–response curve for cell binding of 4D9 mAb (EC50 = 0.29 nM), 4D9 Fab (EC50 = 0.17 nM), and isotype to HEK cells stably overexpressing mouse TREM2. Data represent the mean ± SEM (n = 2).
In vitro ADAM17 sheddase activity is blocked by 4D9‐effectorless mAb and 4D9 Fab fragment but not an isotype control. Fluorescence polarization of FAM‐conjugated TREM2 stalk peptide was detected in the presence or absence of ADAM17 and 4D9 mAb, 4D9 Fab, and isotype control. Data represent the mean ± SEM (n = 6). One‐way ANOVA, Tukey's post hoc test; P (4D9 Fab vs 4D9 mAb) = 0.8855; P (4D9 Fab vs uncleaved) < 0.0001; P (4D9 mAb vs uncleaved) < 0.0001; n.s., not significant.
ELISA‐mediated quantification of sTREM2 in conditioned media from HEK293 cells stably overexpressing mouse TREM2 treated with a dose titration of 4D9 mAb (EC50 = 2.3 nM), 4D9 Fab, or isotype for 18 h. Data represent the mean ± SEM (n = 3).
AlphaLISA‐mediated quantification of p‐SYK levels in HEK293 Flp‐In cells stably overexpressing mouse TREM2 and mouse DAP12 treated with a dose titration of 4D9 mAb, 4D9 Fab, or isotype for 5 min. Data represent the mean ± SEM (n = 3).
AlphaLISA‐mediated quantification of p‐SYK levels in HEK293 Flp‐In cells stably overexpressing mouse TREM2 and mouse DAP12 or empty vector treated with 1 mg/ml POPC/POPS liposomes and 20 μg/ml 4D9 mAb, 4D9 Fab, or isotype for 5 min. p‐SYK levels were also determined for cells treated with liposomes only. Data represent the mean ± SEM (n = 3). Two‐way ANOVA, Tukey's post hoc test (cell line effect: F 1,16 = 365.7, P ≤ 0.0001; treatment effect: F 3,16 = 39.35, P < 0.0001; cell line × treatment effect: F 3,16 = 38.75, P < 0.0001); P (no Ab vs isotype) = 0.6218; P (no Ab vs 4D9 mAb) < 0.0001; P (no Ab vs 4D9 Fab) = 0.7301; P (isotype vs 4D9 mAb) < 0.0001; P (isotype vs 4D9 Fab) > 0.9999; P (4D9 mAb vs 4D9 Fab) < 0.0001; n.s., not significant.
Schematic representation of the proposed mechanism of action of antibody 4D9. Binding of 4D9 to TREM2 leads to receptor clustering on the cell surface, thereby driving downstream p‐SYK signaling. At the same time, cell‐surface levels are enhanced by inhibition of ectodomain shedding, potentially because of the inability of proteases to cleave dimeric substrates.
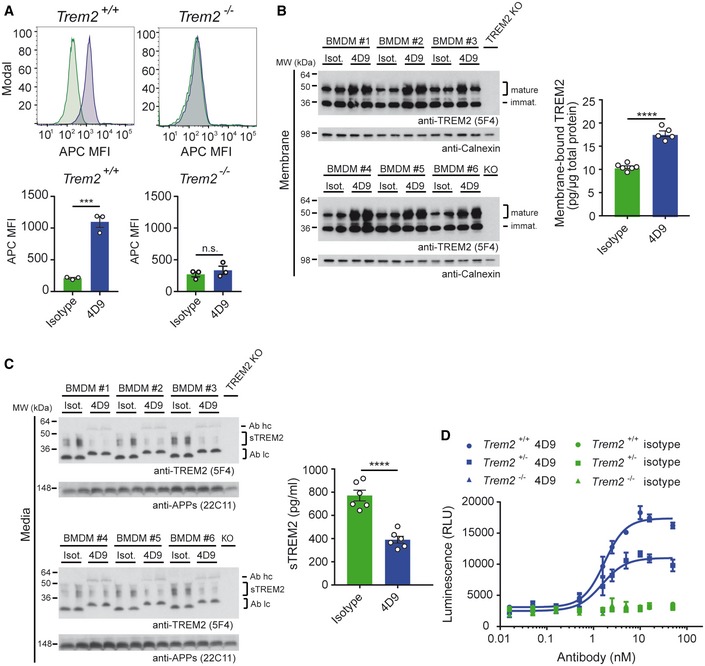
Flow cytometry detection of cell‐surface binding of 4D9 (blue) and isotype (green) to wild‐type and Trem2 −/− mouse bone marrow‐derived macrophages. Representative histograms are shown as MFI (mean fluorescent intensity). Graphs represent the median signal intensity ± SEM (n = 3). Student's t‐test (two‐tailed); Trem2 +/+: P = 0.0005; Trem2 −/−: P = 0.4435; n.s., not significant.
Immunoblot analysis of membrane fractions of bone marrow‐derived macrophages (BMDMs) upon treatment with 4D9 antibody reveals increased levels of membrane‐bound TREM2 relative to an isotype antibody. BMDMs from TREM2 knockout mice were included to show the specificity of the anti‐TREM2 antibody. Calnexin served as a loading control. Levels of membrane‐bound TREM2 were quantified by MSD ELISA. TREM2 antibody clone 5F4 was used for detection. Data represent the mean ± SEM (n = 5–6). Unpaired t‐test (two‐tailed) with Welch's correction; P < 0.0001. No gender‐specific differences could be observed.
Immunoblot analysis of sTREM2 in conditioned media from BMDM upon treatment with 4D9 and isotype antibodies. BMDMs from TREM2 knockout mice were included to show the specificity of the anti‐TREM2 antibody. Soluble APP served as a loading control. Note that heavy and light chains of the antibodies used for treatment are also detected and annotated as follows: Ab hc, antibody heavy chain; Ab lc, antibody light chain. Levels of sTREM2 were quantified by MSD ELISA. TREM2 antibody clone 5F4 was used for detection. Data represent the mean ± SEM (n = 6). Unpaired t‐test (two‐tailed) with Welch's correction; P < 0.0001. No gender‐specific differences could be observed.
Wild‐type, Trem2 +/−, and Trem2 −/− BMDMs were plated in low concentration of M‐CSF on 4D9 or isotype‐coated wells for 5 days, and cellular ATP levels were measured by luminescence detection to indicate cell viability. 4D9 and isotype data for each genotype represent the mean ± SEM (n = 2 and n = 1, respectively).
- A
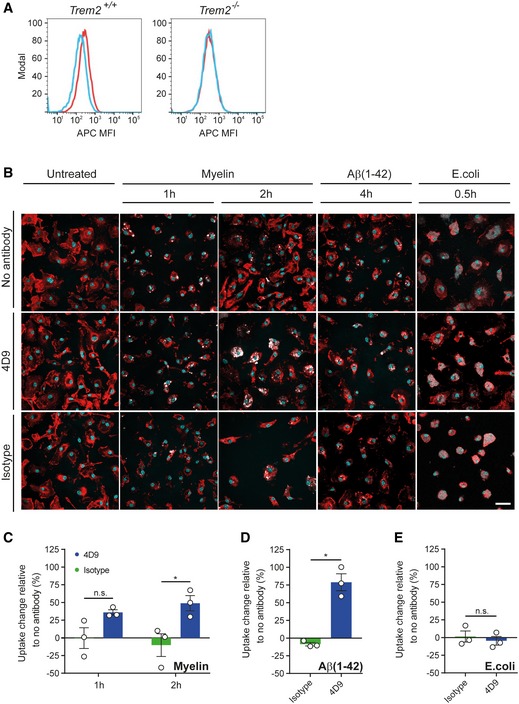
Flow cytometry detection of cell‐surface 4D9 (red) binding and isotype control (blue) on primary wild‐type and Trem2 −/− mouse microglia. Data are shown as mean fluorescent intensity (MFI).
- B
Uptake assay for fluorescently labeled myelin, Aβ(1–42), and inactivated Escherichia coli particles. The top row shows that myelin and Aβ (pseudocolored in white) accumulate within the plasma membrane of primary microglia (labeled with DyLight 649 isolectin and pseudocolored in red). Overnight, pre‐treatment with antibody 4D9 significantly increased the percentage of substrate‐positive cells (middle row). Pre‐treatment with the isotope control did not affect the uptake rate (bottom row). No changes in the uptake of E. coli particles were observed. Substrate uptake in the absence of antibody is shown in the top row. Hoechst 33342 was used to counter stain the nuclei (in cyan) and to assess cell density. Scale bar = 20 μm.
- C–E
Quantification of the change in uptake of myelin (C), Aβ(1–42) (D), and E. coli (E) upon antibody treatment relative to the uptake of the respective substrate in the absence of antibody. The number of substrate‐positive cells relative to the total number of cells was quantified in each condition. Data represent the mean ± SEM (n = 3). Two‐way ANOVA (myelin), Sidak's multiple comparisons test (time effect: F 1,4 = 0.01123, P = 0.9207; treatment effect: F 1,4 = 27.98, P = 0.0061; time x treatment effect: F 1,4 = 0.5948, P = 0.4836); P (1 h) = 0.1362; P (2 h) = 0.0185; unpaired t‐test (two‐tailed) with Welch's correction (Aβ(1–42) and E. coli); P (Aβ(1–42)) = 0.0151; P (E. coli) = 0.5751; n.s., not significant.
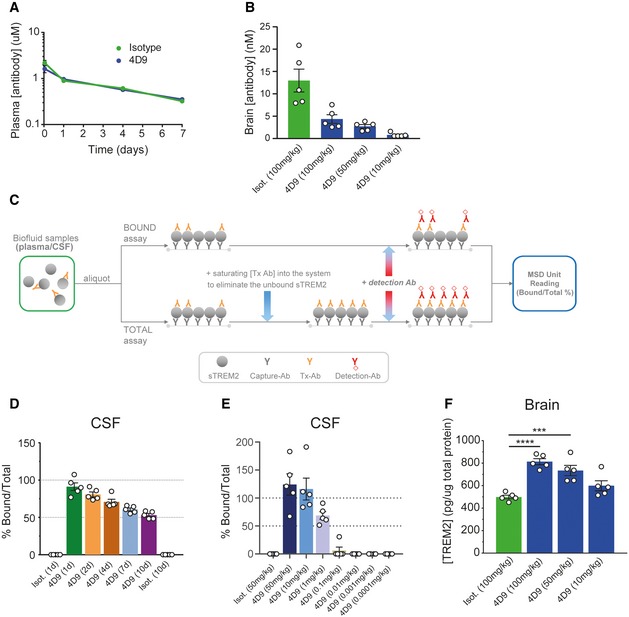
4D9 demonstrates standard IgG pharmacokinetics in vivo. Peripheral clearance rates of 4D9 on a human IgG‐effectorless backbone compared with an isotype control were determined in wild‐type mice by hIgG ELISA detection of plasma antibody concentrations 1 and 24 h, and 4 and 7 days after 10 mg/kg intravenous injection of antibody.
Brain antibody concentration was measured 24 h post‐intravenous dosing of isotype hIgG at 100 mg/kg, and 4D9‐hIgG dosed intravenously at 100, 50, and 10 mg/kg. Detection of hIgG levels by ELISA demonstrated dose‐dependent brain concentrations of 4D9 in the single digit nM range. Animals were perfused to minimize IgG contribution from the plasma. Data represent the mean ± SEM (n = 5).
Schematic depicting the TE assay setup for bound and total sTREM2 detection. For the bound assay, a secondary anti‐human IgG detects 4D9 antibody bound to soluble TREM2 in CSF and plasma. For the total assay, a saturating amount of 4D9 antibody is added to eliminate unbound sTREM2. The ratio of 4D9‐bound sTREM2 to total sTREM2 is calculated to determine the level of TE achieved by the concentration of antibody present.
Target engagement time course demonstrated near 100% 4D9‐bound sTREM2 in CSF of wild‐type mice at 24 h post‐dose. Over a 10‐day time course with time points at days 1, 2, 4, and 7 and study termination at day 10, the bound/total sTREM2 reduces gradually to reach ˜ 50% by day 10. Animals were dosed intravenously with 50 mg/kg of isotype and 4D9 antibodies. Data represent the mean ± SEM (n = 5).
Target engagement dose response demonstrated saturated bound sTREM2 at 50 and 10 mg/kg with > 50% bound sTREM2 at 1 mg/kg of antibody. 4D9‐bound sTREM2 was undetectable at 0.1 mg/kg and lower. 4D9 was IV‐dosed at 50, 10, 1, 0.1, 0.01, 0.001, and 0.0001 mg/kg, and isotype‐dosed at 50 mg/kg. CSF bound: total sTREM2 in wild‐type mice was measured at 24 h. Data represent the mean ± SEM (n = 5).
4D9 antibody demonstrates a dose‐dependent increase in total brain TREM2 levels. Quantification of total TREM2 in brain lysates from wild‐type mice dosed with 4D9 or isotype control was performed by a MSD‐platform‐based ELISA. Data represent the mean ± SEM (n = 5) and are shown as pg TREM2 per ug of total protein. One‐way ANOVA, Dunnett's post hoc test, P (isotype vs 4D9 [100 mg/kg]) < 0.0001; P (isotype vs 4D9 [50 mg/kg]) = 0.0007.
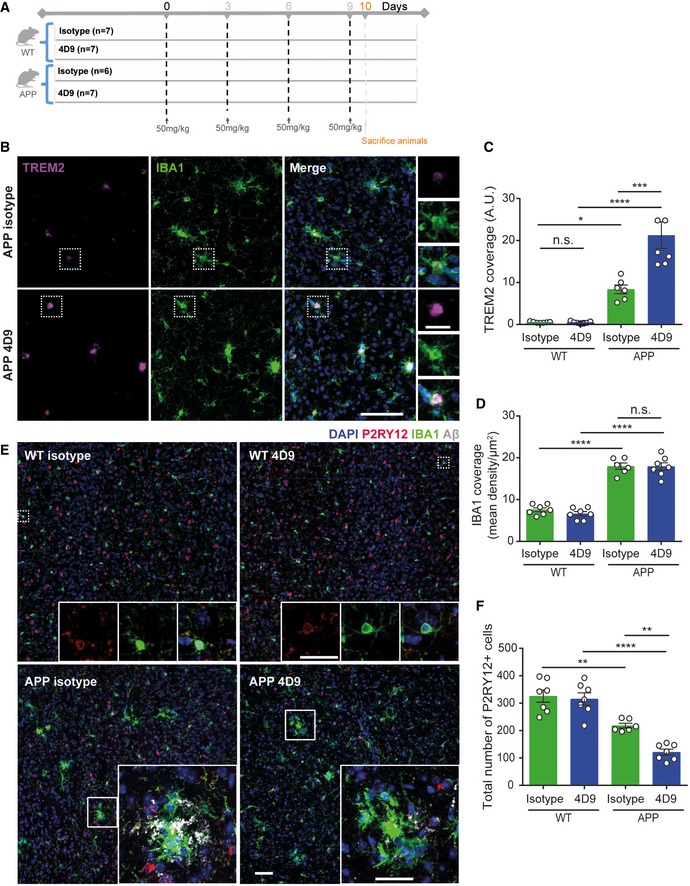
Schematic outlining study design and timeline of intraperitoneal injections of either isotype control of 4D9 antibody in 6‐month‐old APP‐NL‐G‐F and age‐matched WT mice.
Immunohistochemical costainings of TREM2 (magenta) and IBA1 (green) microglia in the cortex of isotype control and 4D9‐injected WT and APP‐NL‐G‐F mice. Side panel shows images from each staining at a larger magnification indicated by the dotted white boxes. Scale bar = 10 μm; scale bar (inset) = 2.5 μm.
Quantification of cortical TREM2 stainings shown in (B). Two‐way ANOVA, Tukey's multiple comparison test (genotype effect: F 1,23 = 70.63, P ≤ 0.0001; treatment effect: F 1,23 = 14.33, P = 0.0010; genotype × treatment effect: F 1,23 = 14.51, P = 0.0009); P (WT isotype vs WT 4D9) > 0.9999; P (WT isotype vs APP isotype) = 0.02; P (WT 4D9 vs APP 4D9) < 0.0001; P (APP isotype vs APP 4D9) = 0.0001; n.s., not significant.
Quantification of cortical IBA1 staining shown in B. Two‐way ANOVA, Tukey's multiple comparison test (genotype effect: F 1,21 = 215.4, P ≤ 0.0001; treatment effect: F 1,21 = 0.5994, P = 0.4475; genotype × treatment effect: F 1,21 = 0.2992, P = 0.5902); P (WT isotype vs APP isotype) < 0.0001; P (WT 4D9 vs APP 4D9) < 0.0001; P (APP isotype vs APP 4D9) = 0.9986; n.s., not significant.
Confocal images of P2RY12 (red), IBA1 (green), and Aβ (gray) costainings from cortex. Top panel: Dotted white boxes indicate the areas in P2RY12 and IBA1 costainings that are magnified as inset. Bottom panel: Insets show P2RY12, IBA1, and Aβ costainings at a larger magnification. Of note, we did not observe a complete co‐localization of P2RY12 and IBA1 suggesting different microglial populations. Scale bar = 10 μm; scale bar (insets) = 5 μm.
Quantification of P2RY12‐stained cells in the cortex shown in (E). Two‐way ANOVA, Tukey's multiple comparison test (genotype effect: F 1,23 = 71.99, P ≤ 0.0001; treatment effect: F 1,23 = 9.029, P = 0.0063; genotype × treatment effect: F 1,23 = 5.93, P = 0.0231); P (WT isotype vs APP isotype) = 0.0018; P (WT 4D9 vs APP 4D9) < 0.0001; P (APP isotype vs APP 4D9) = 0.0051.
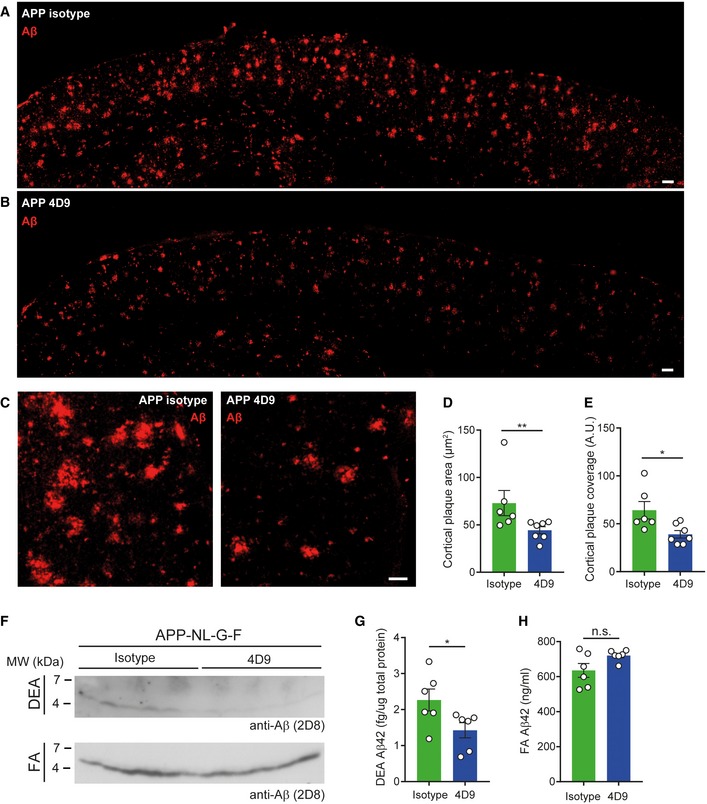
- A, B
Overview of the cortex immunohistochemically stained for Aβ plaques in 6‐month‐old APP‐NL‐G‐F mice treated with isotype control (A) and 4D9 antibody (B). Scale bar = 100 μm.
- C
Higher magnification images of cortical Aβ plaques in APP isotype and 4D9‐injected mice. Scale bar = 10 μm.
- D
Quantification of cortical plaque area from stainings shown in (C). Mann–Whitney U‐test, P = 0.0082.
- E
Quantification of total plaque coverage of Aβ stainings in the cortex shown in (C). Mann–Whitney U‐test, P = 0.014.
- F
Immunoblot analysis of soluble (DEA fraction, top) and insoluble Aβ levels (FA fraction, bottom) in brains of APP‐NL‐G‐F mice treated with either isotype control or 4D9 antibody. While a reduction in levels of soluble Aβ is evident from the DEA fractions, no change in levels of insoluble Aβ could be detected in the FA fractions. Note that the higher background in the DEA immunoblot is due to a much longer exposure time, which was needed to visualize soluble Aβ.
- G
MSD ELISA quantification of soluble Aβ42 in DEA extracts as shown in (F). Mann–Whitney U‐test, P = 0.026.
- H
MSD ELISA quantification of insoluble Aβ42 in FA extracts as shown in (F). Unpaired t‐test (two‐tailed) with Welch's correction; P = 0.0877.
References
-
- Borroni B, Ferrari F, Galimberti D, Nacmias B, Barone C, Bagnoli S, Fenoglio C, Piaceri I, Archetti S, Bonvicini C et al (2014) Heterozygous TREM2 mutations in frontotemporal dementia. Neurobiol Aging 35: 934.e937–910 - PubMed
-
- Bradbury A (2010) Antibody engineering, Vol. 1 Berlin Heidelberg: Springer‐Verlag;
Publication types
MeSH terms
Substances
Grants and funding
- EXC 2145; ID 390857198 SyNergy/Deutsche Forschungsgemeinschaft (DFG)/International
- HA1737/16-1/Deutsche Forschungsgemeinschaft (DFG)/International
- ZT-0027/Helmholtz Association/International
- Dr. Miriam and Sheldon G. Adelson Medical Research Foundation (AMRF)/International
- 115976/Innovative Medicines Initiative (IMI)/International
LinkOut - more resources
Full Text Sources
Other Literature Sources
Medical
Molecular Biology Databases
Miscellaneous
