

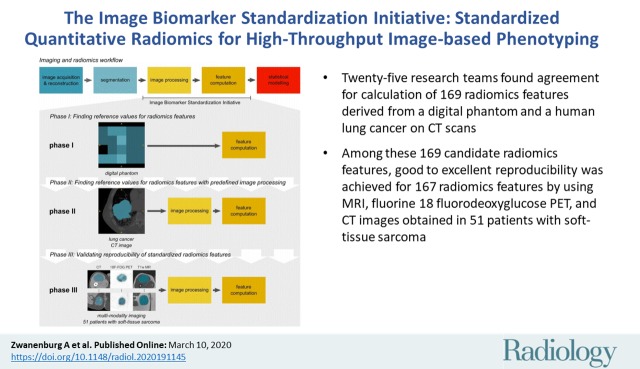
The Image Biomarker Standardization Initiative: Standardized Quantitative Radiomics for High-Throughput Image-based Phenotyping
- PMID: 32154773
- PMCID: PMC7193906
- DOI: 10.1148/radiol.2020191145
The Image Biomarker Standardization Initiative: Standardized Quantitative Radiomics for High-Throughput Image-based Phenotyping
Abstract
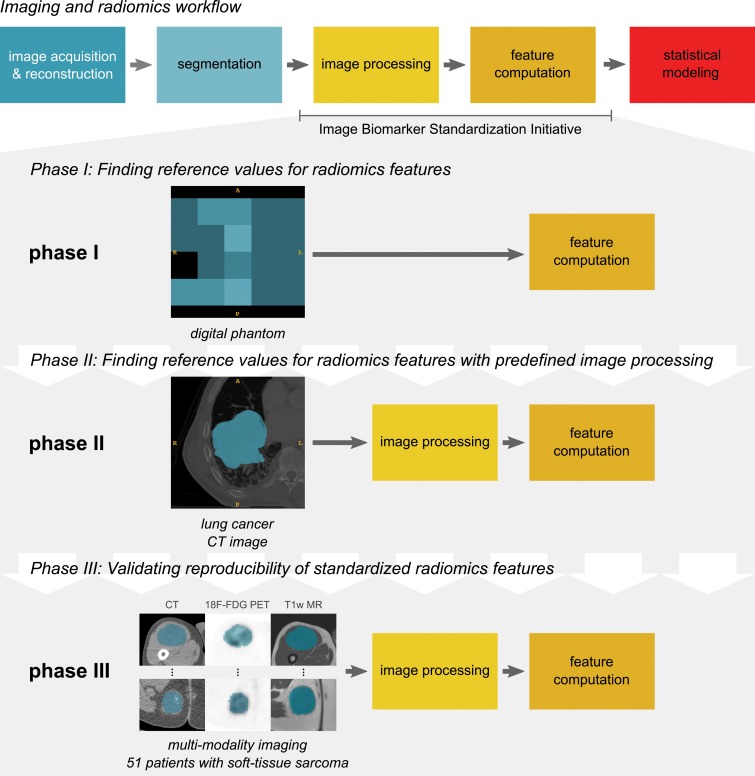
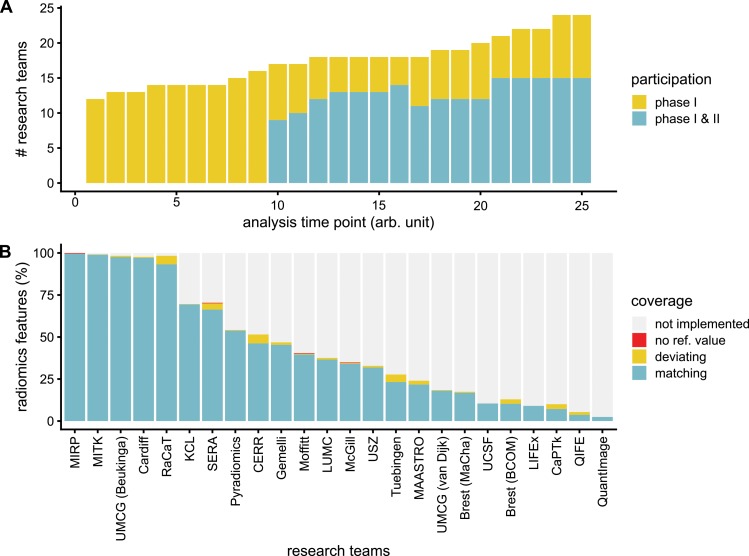
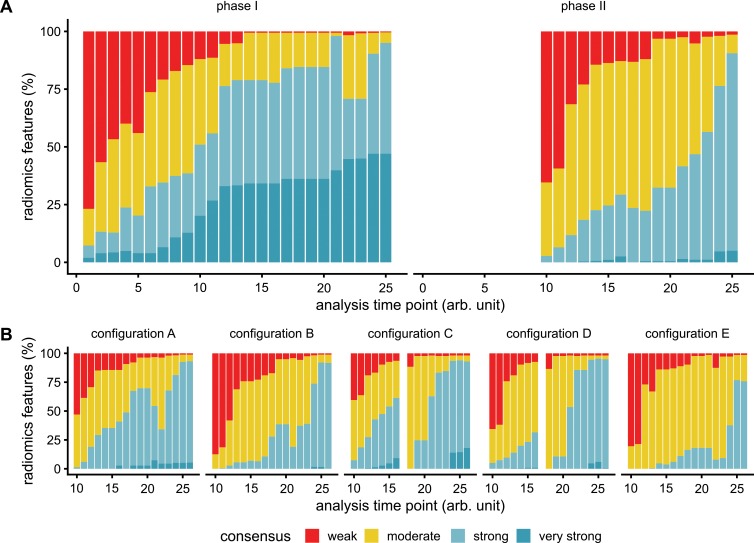
Background Radiomic features may quantify characteristics present in medical imaging. However, the lack of standardized definitions and validated reference values have hampered clinical use. Purpose To standardize a set of 174 radiomic features. Materials and Methods Radiomic features were assessed in three phases. In phase I, 487 features were derived from the basic set of 174 features. Twenty-five research teams with unique radiomics software implementations computed feature values directly from a digital phantom, without any additional image processing. In phase II, 15 teams computed values for 1347 derived features using a CT image of a patient with lung cancer and predefined image processing configurations. In both phases, consensus among the teams on the validity of tentative reference values was measured through the frequency of the modal value and classified as follows: less than three matches, weak; three to five matches, moderate; six to nine matches, strong; 10 or more matches, very strong. In the final phase (phase III), a public data set of multimodality images (CT, fluorine 18 fluorodeoxyglucose PET, and T1-weighted MRI) from 51 patients with soft-tissue sarcoma was used to prospectively assess reproducibility of standardized features. Results Consensus on reference values was initially weak for 232 of 302 features (76.8%) at phase I and 703 of 1075 features (65.4%) at phase II. At the final iteration, weak consensus remained for only two of 487 features (0.4%) at phase I and 19 of 1347 features (1.4%) at phase II. Strong or better consensus was achieved for 463 of 487 features (95.1%) at phase I and 1220 of 1347 features (90.6%) at phase II. Overall, 169 of 174 features were standardized in the first two phases. In the final validation phase (phase III), most of the 169 standardized features could be excellently reproduced (166 with CT; 164 with PET; and 164 with MRI). Conclusion A set of 169 radiomics features was standardized, which enabled verification and calibration of different radiomics software. © RSNA, 2020 Online supplemental material is available for this article. See also the editorial by Kuhl and Truhn in this issue.
Figures

Comment in
-
The Long Route to Standardized Radiomics: Unraveling the Knot from the End.Radiology. 2020 May;295(2):339-341. doi: 10.1148/radiol.2020200059. Epub 2020 Mar 10. Radiology. 2020. PMID: 32159452 No abstract available.
References
-
- La Thangue NB, Kerr DJ. . Predictive biomarkers: A paradigm shift towards personalized cancer medicine . Nat Rev Clin Oncol 2011. ; 8 ( 10 ): 587 – 596 . - PubMed
-
- Lambin P, Leijenaar RTH, Deist TM, et al . Radiomics: The bridge between medical imaging and personalized medicine . Nat Rev Clin Oncol 2017. ; 14 ( 12 ): 749 – 762 . - PubMed
-
- Morin O, Vallières M, Jochems A, et al . A Deep Look into the Future of Quantitative Imaging in Oncology: A Statement of Working Principles and Proposal for Change . Int J Radiat Oncol Biol Phys 2018. ; 102 ( 4 ): 1074 – 1082 . - PubMed
Publication types
MeSH terms
Substances
Grants and funding
- U24 CA180918/CA/NCI NIH HHS/United States
- R01 CA198121/CA/NCI NIH HHS/United States
- U01 CA187947/CA/NCI NIH HHS/United States
- U01 CA143062/CA/NCI NIH HHS/United States
- 09/22/49/DH_/Department of Health/United Kingdom
- P30 CA008748/CA/NCI NIH HHS/United States
- WT203148/Z/16/Z/WT_/Wellcome Trust/United Kingdom
- S10 OD023495/OD/NIH HHS/United States
- R01 NS042645/NS/NINDS NIH HHS/United States
- WT_/Wellcome Trust/United Kingdom
- U24 CA189523/CA/NCI NIH HHS/United States
- U01 CA190234/CA/NCI NIH HHS/United States
- U24 CA194354/CA/NCI NIH HHS/United States
LinkOut - more resources
Full Text Sources
Other Literature Sources
Medical
