

Performance of Radiologists in Differentiating COVID-19 from Non-COVID-19 Viral Pneumonia at Chest CT
- PMID: 32155105
- PMCID: PMC7233414
- DOI: 10.1148/radiol.2020200823
Performance of Radiologists in Differentiating COVID-19 from Non-COVID-19 Viral Pneumonia at Chest CT
Abstract
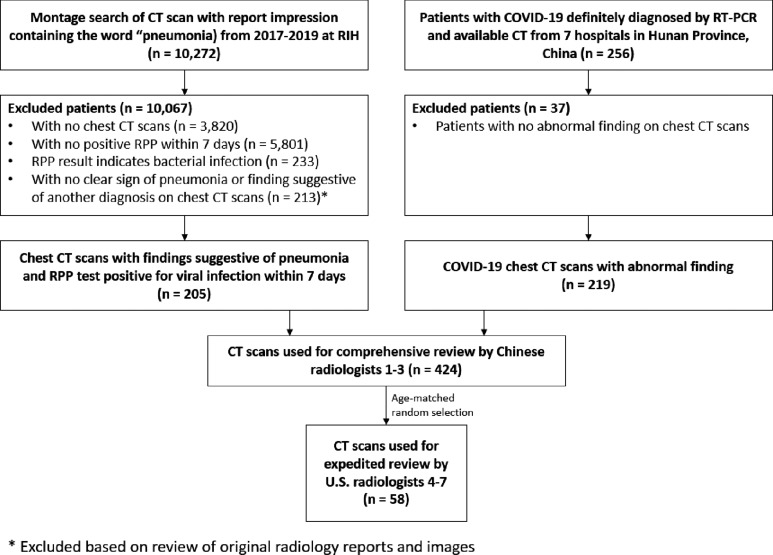
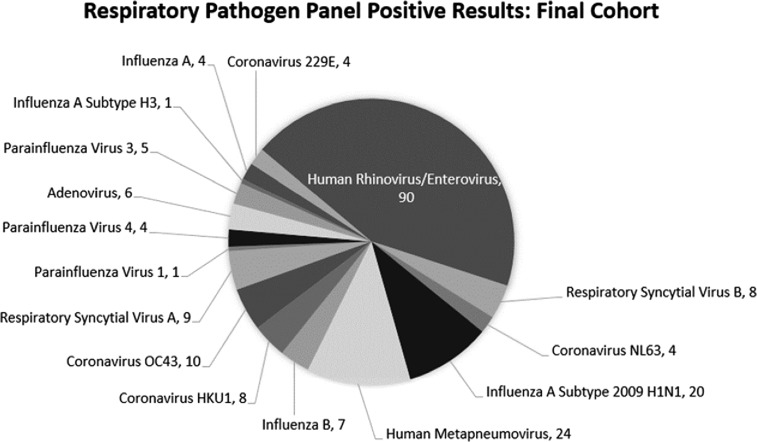
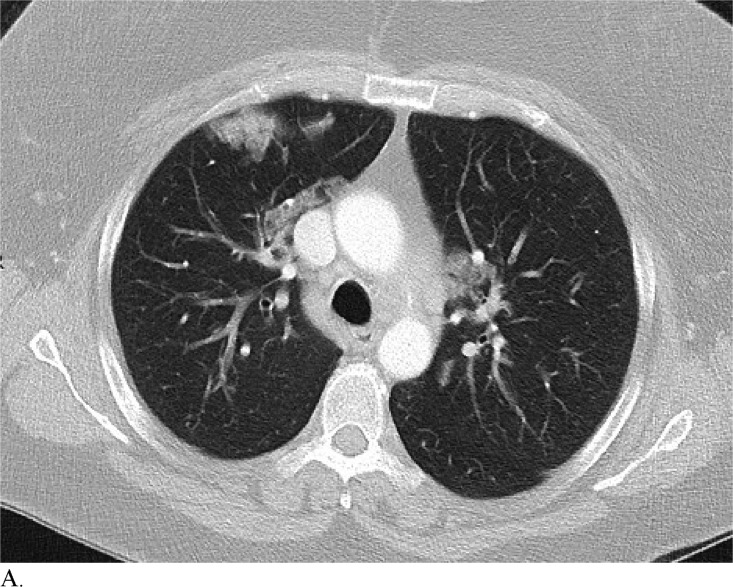
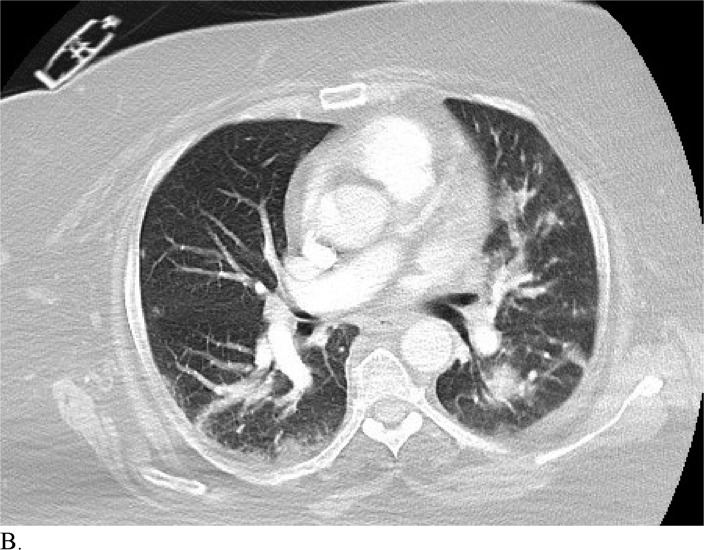
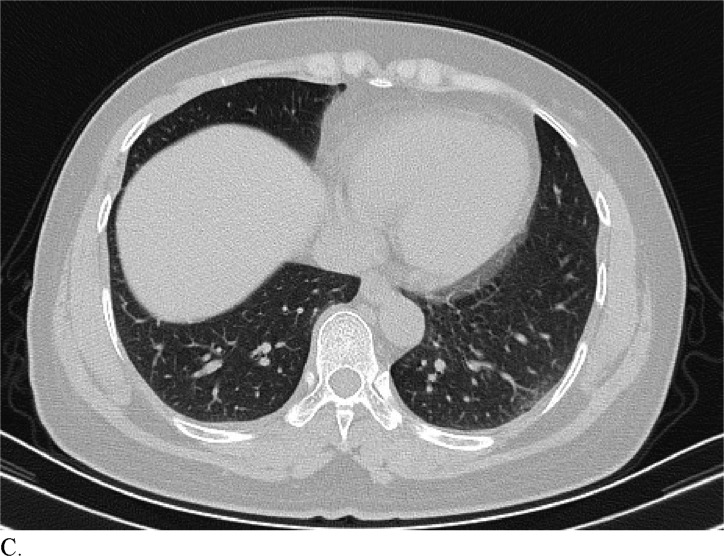
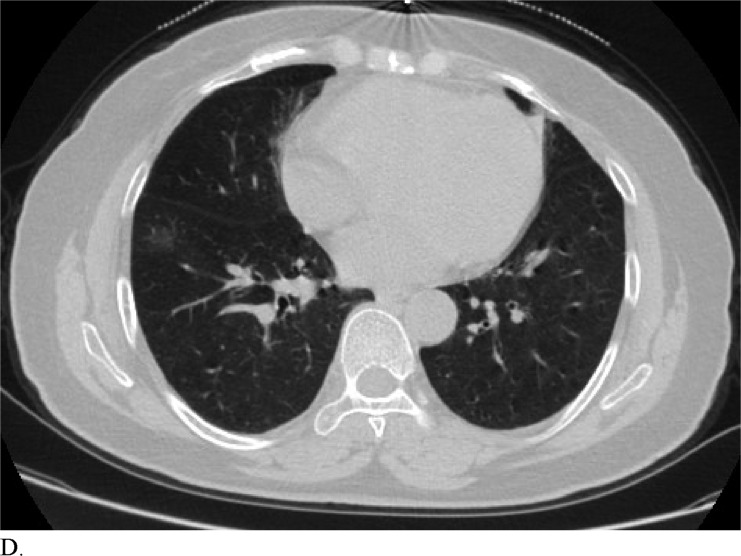
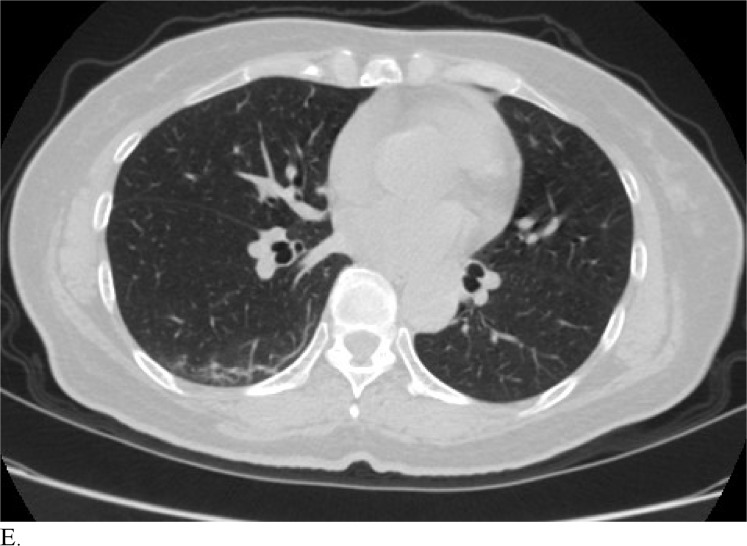
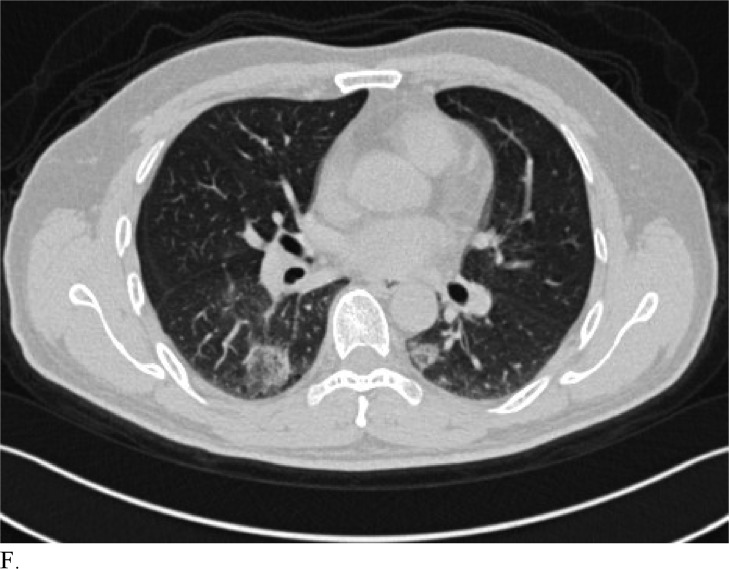
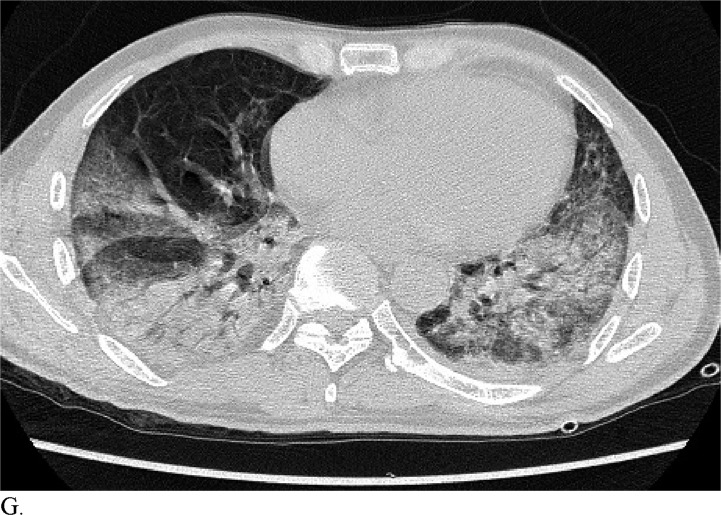
Background Despite its high sensitivity in diagnosing coronavirus disease 2019 (COVID-19) in a screening population, the chest CT appearance of COVID-19 pneumonia is thought to be nonspecific. Purpose To assess the performance of radiologists in the United States and China in differentiating COVID-19 from viral pneumonia at chest CT. Materials and Methods In this study, 219 patients with positive COVID-19, as determined with reverse-transcription polymerase chain reaction (RT-PCR) and abnormal chest CT findings, were retrospectively identified from seven Chinese hospitals in Hunan Province, China, from January 6 to February 20, 2020. Two hundred five patients with positive respiratory pathogen panel results for viral pneumonia and CT findings consistent with or highly suspicious for pneumonia, according to original radiologic interpretation within 7 days of each other, were identified from Rhode Island Hospital in Providence, RI. Three radiologists from China reviewed all chest CT scans (n = 424) blinded to RT-PCR findings to differentiate COVID-19 from viral pneumonia. A sample of 58 age-matched patients was randomly selected and evaluated by four radiologists from the United States in a similar fashion. Different CT features were recorded and compared between the two groups. Results For all chest CT scans (n = 424), the accuracy of the three radiologists from China in differentiating COVID-19 from non-COVID-19 viral pneumonia was 83% (350 of 424), 80% (338 of 424), and 60% (255 of 424). In the randomly selected sample (n = 58), the sensitivities of three radiologists from China and four radiologists from the United States were 80%, 67%, 97%, 93%, 83%, 73%, and 70%, respectively. The corresponding specificities of the same readers were 100%, 93%, 7%, 100%, 93%, 93%, and 100%, respectively. Compared with non-COVID-19 pneumonia, COVID-19 pneumonia was more likely to have a peripheral distribution (80% vs 57%, P < .001), ground-glass opacity (91% vs 68%, P < .001), fine reticular opacity (56% vs 22%, P < .001), and vascular thickening (59% vs 22%, P < .001), but it was less likely to have a central and peripheral distribution (14% vs 35%, P < .001), pleural effusion (4% vs 39%, P < .001), or lymphadenopathy (3% vs 10%, P = .002). Conclusion Radiologists in China and in the United States distinguished coronavirus disease 2019 from viral pneumonia at chest CT with moderate to high accuracy. © RSNA, 2020 Online supplemental material is available for this article. A translation of this abstract in Farsi is available in the supplement. ترجمه چکیده این مقاله به فارسی، در ضمیمه موجود است.
Figures

Comment in
-
Pneumonia misinterpretation in COVID-19: Review and update.Int J Infect Dis. 2020 Nov;100:152-153. doi: 10.1016/j.ijid.2020.08.067. Epub 2020 Aug 28. Int J Infect Dis. 2020. PMID: 32866639 Free PMC article. No abstract available.
References
-
- Centers for Disease Control and Prevention . Coronavirus Disease 2019 (COVID-19) Locations with Confirmed COVID-19 Cases. https://www.cdc.gov/coronavirus/2019-ncov/locations-confirmed-cases.html. Published February 29, 2020. Accessed March 1, 2020.
-
- World Health Organization . Coronavirus Disease 2019 (COVID-19) Situation Reports – 41. https://www.who.int/emergencies/diseases/novel-coronavirus-2019/situatio.... Published March 1, 2020. Accessed March 1, 2020.
-
- World Health Organization . Statement on the Second Meeting of the International Health Regulations (2005) Emergency Committee Regarding the Outbreak of Novel Coronavirus (2019-nCoV). 2020. https://www.who.int/news-room/detail/30-01-2020-statement-on-the-second-.... Published January 31, 2020. Accessed February 29, 2020.
Publication types
MeSH terms
LinkOut - more resources
Full Text Sources
Other Literature Sources
Medical
