

Downregulated Long Non-Coding RNA MSC-AS1 Inhibits Osteosarcoma Progression and Increases Sensitivity to Cisplatin by Binding to MicroRNA-142
- PMID: 32155139
- PMCID: PMC7081928
- DOI: 10.12659/MSM.921594
Downregulated Long Non-Coding RNA MSC-AS1 Inhibits Osteosarcoma Progression and Increases Sensitivity to Cisplatin by Binding to MicroRNA-142
Abstract
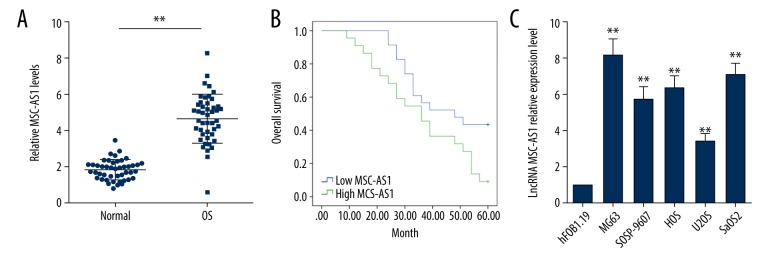
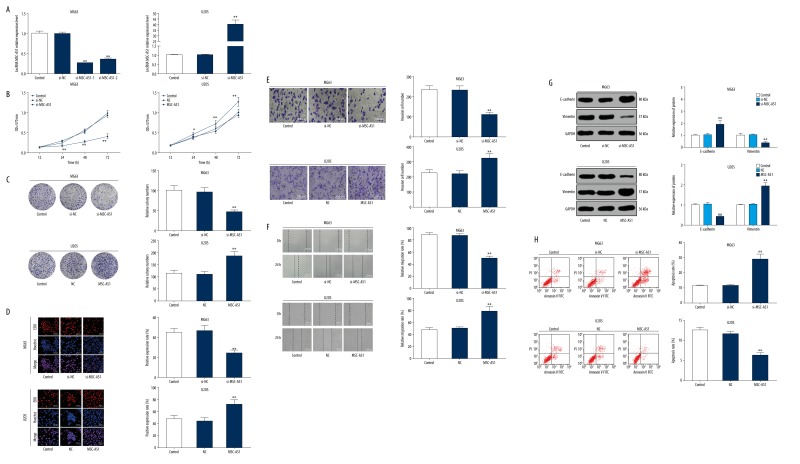
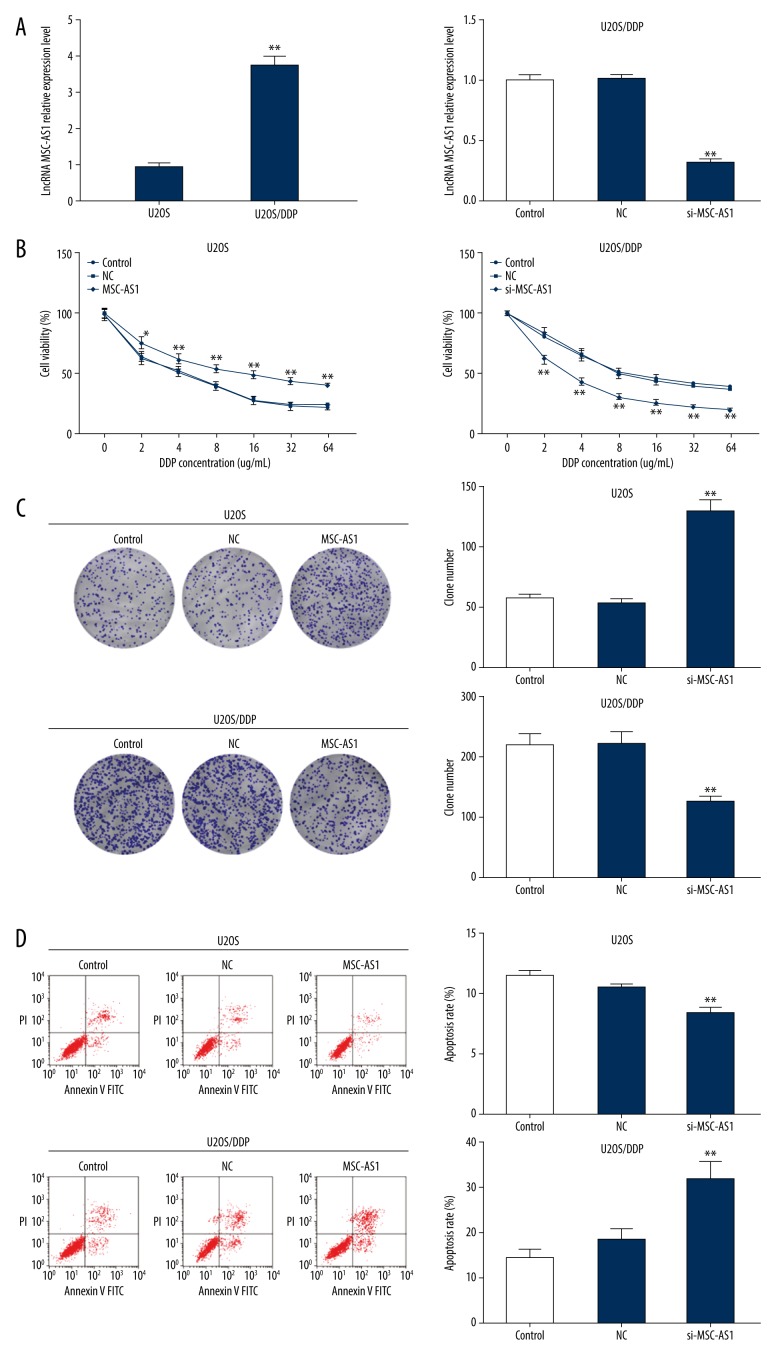
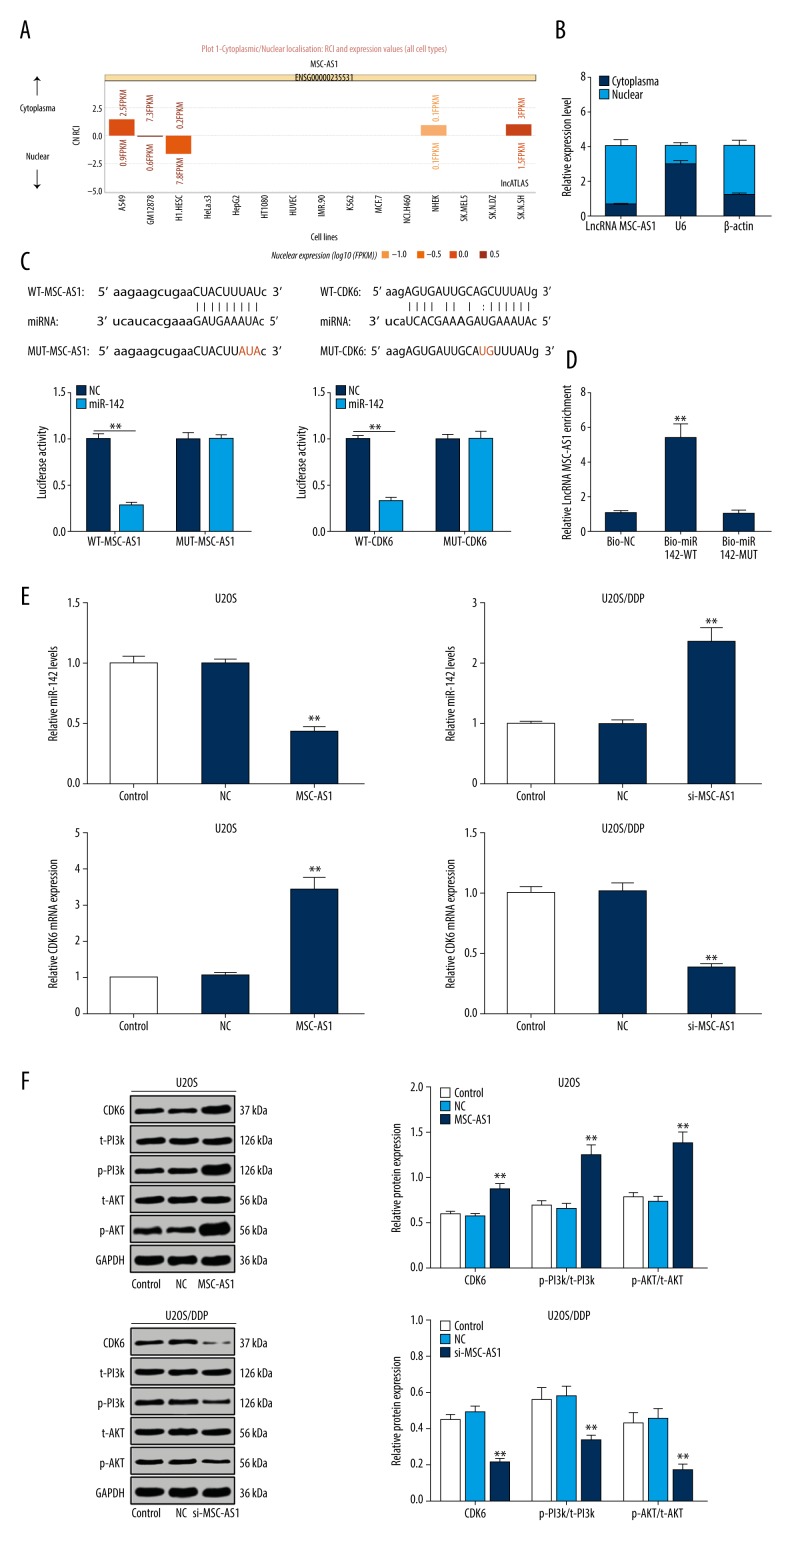
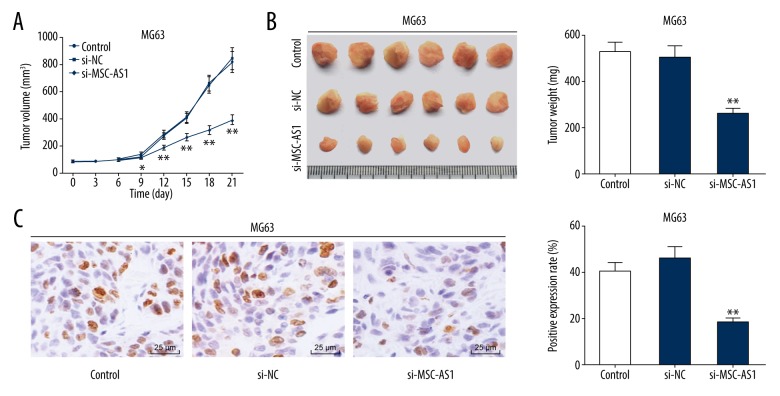
BACKGROUND Osteosarcoma (OS) is the most prevalent malignant primary bone tumor, resulting from severe transformation of primitive mesenchymal cells, which induces osteogenesis. Long non-coding RNA (lncRNA) MSC-AS1 triggers osteogenic differentiation by sponging microRNA (miR)-140-5p. The present study assessed the mechanism of lncRNA MSC-AS1 in OS biological features and sensitivity to cisplatin (DDP) by binding to miR-142. MATERIAL AND METHODS Firstly, lncRNA MSC-AS1 expression in OS tissues and cells was analyzed. OS cells were transfected with silenced MSC-AS1 to determine its role in OS biological behaviors, and we also assessed the effect of MSC-AS1 on OS sensitivity to DDP. Then, website prediction and dual-luciferase reporter gene assay were utilized for verification of the binding site between MSC-AS1 and miR-142. Reverse transcription-quantitative polymerase chain reaction (RT-qPCR) and Western blot analysis were performed to determine the effect of MSC-AS1 on expression of miR-142, cyclin-dependent kinase 6 (CDK6), and the PI3K/AKT signaling pathway. Xenograft transplantation was also applied to confirm the in vitro experiments. RESULTS Overexpressed MSC-AS1 was associated with poor prognosis of OS patients. OS cell proliferation, invasion, and migration were reduced after silencing MSC-AS1, while cell apoptosis was enhanced. Moreover, silencing MSC-AS1 made OS cells more sensitive to DDP. Interestingly, MSC-AS1 knockdown induced miR-142 expression and reduced CDK6 levels, thereby decreasing the protein expression of p-PI3K/t-PI3K and p-AKT/t-AKT. Silencing MSC-AS1 repressed OS progression in vivo. CONCLUSIONS Our study demonstrated that silencing MSC-AS1 inhibited OS biological behaviors by enhancing miR-142 to decrease CDK6 and inactivating the PI3K/AKT axis. Our results may provide new insights for OS treatment.
Conflict of interest statement
None.
Figures
Similar articles
-
Long noncoding RNA OIP5-AS1 causes cisplatin resistance in osteosarcoma through inducing the LPAATβ/PI3K/AKT/mTOR signaling pathway by sponging the miR-340-5p.J Cell Biochem. 2019 Jun;120(6):9656-9666. doi: 10.1002/jcb.28244. Epub 2018 Dec 11. J Cell Biochem. 2019. PMID: 30548308
-
Downregulation of long non-coding RNA DBH-AS1 inhibits osteosarcoma progression by PI3K-AKT signaling pathways and indicates good prognosis.Eur Rev Med Pharmacol Sci. 2019 Feb;23(4):1418-1427. doi: 10.26355/eurrev_201902_17098. Eur Rev Med Pharmacol Sci. 2019. PMID: 30840262
-
LncRNA DSCAM-AS1 promoted cell proliferation and invasion in osteosarcoma by sponging miR-101.Eur Rev Med Pharmacol Sci. 2020 Jul;24(14):7709-7717. doi: 10.26355/eurrev_202007_22274. Eur Rev Med Pharmacol Sci. 2020. PMID: 32744697
-
Long Non-coding RNAs in Cisplatin Resistance in Osteosarcoma.Curr Treat Options Oncol. 2021 Mar 20;22(5):41. doi: 10.1007/s11864-021-00839-y. Curr Treat Options Oncol. 2021. PMID: 33745006 Review.
-
The emerging role of non-coding RNAs in the regulation of PI3K/AKT pathway in the carcinogenesis process.Biomed Pharmacother. 2021 May;137:111279. doi: 10.1016/j.biopha.2021.111279. Epub 2021 Jan 23. Biomed Pharmacother. 2021. PMID: 33493969 Review.
Cited by
-
Targeting signaling pathways in osteosarcoma: Mechanisms and clinical studies.MedComm (2020). 2023 Jul 10;4(4):e308. doi: 10.1002/mco2.308. eCollection 2023 Aug. MedComm (2020). 2023. PMID: 37441462 Free PMC article. Review.
-
Interaction of ncRNAs and the PI3K/AKT/mTOR pathway: Implications for osteosarcoma.Open Life Sci. 2024 Aug 6;19(1):20220936. doi: 10.1515/biol-2022-0936. eCollection 2024. Open Life Sci. 2024. PMID: 39119480 Free PMC article. Review.
-
Construction of lncRNA-related ceRNA regulatory network in diabetic subdermal endothelial cells.Bioengineered. 2021 Dec;12(1):2592-2602. doi: 10.1080/21655979.2021.1936892. Bioengineered. 2021. PMID: 34124997 Free PMC article.
-
Osteosarcoma in a ceRNET perspective.J Biomed Sci. 2024 Jun 5;31(1):59. doi: 10.1186/s12929-024-01049-y. J Biomed Sci. 2024. PMID: 38835012 Free PMC article. Review.
-
LncRNA MSC-AS1 Is a Diagnostic Biomarker and Predicts Poor Prognosis in Patients With Gastric Cancer by Integrated Bioinformatics Analysis.Front Med (Lausanne). 2021 Dec 2;8:795427. doi: 10.3389/fmed.2021.795427. eCollection 2021. Front Med (Lausanne). 2021. PMID: 34926534 Free PMC article.
References
-
- Biazzo A, De Paolis M. Multidisciplinary approach to osteosarcoma. Acta Orthop Belg. 2016;82(4):690–98. - PubMed
-
- Jia J, Tian Q, Liu Y, et al. Interactive effect of bisphenol A (BPA) exposure with −22G/C polymorphism in LOX gene on the risk of osteosarcoma. Asian Pac J Cancer Prev. 2013;14(6):3805–8. - PubMed
MeSH terms
Substances
LinkOut - more resources
Full Text Sources
Medical
Miscellaneous
