. 2020 Mar 10;15(3):e0227962.
doi: 10.1371/journal.pone.0227962. eCollection 2020.

Genetic evolution of influenza viruses among selected countries in Latin America, 2017-2018

Affiliations

Genetic evolution of influenza viruses among selected countries in Latin America, 2017-2018

Juliana Almeida Leite et al. PLoS One. .

Abstract

Objective: Since the 2009 influenza pandemic, Latin American (LA) countries have strengthened their influenza surveillance systems. We analyzed influenza genetic sequence data from the 2017 through 2018 Southern Hemisphere (SH) influenza season from selected LA countries, to map the availability of influenza genetic sequence data from, and to describe, the 2017 through 2018 SH influenza seasons in LA.

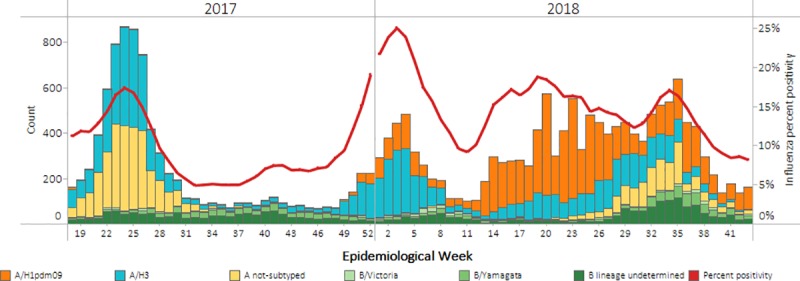
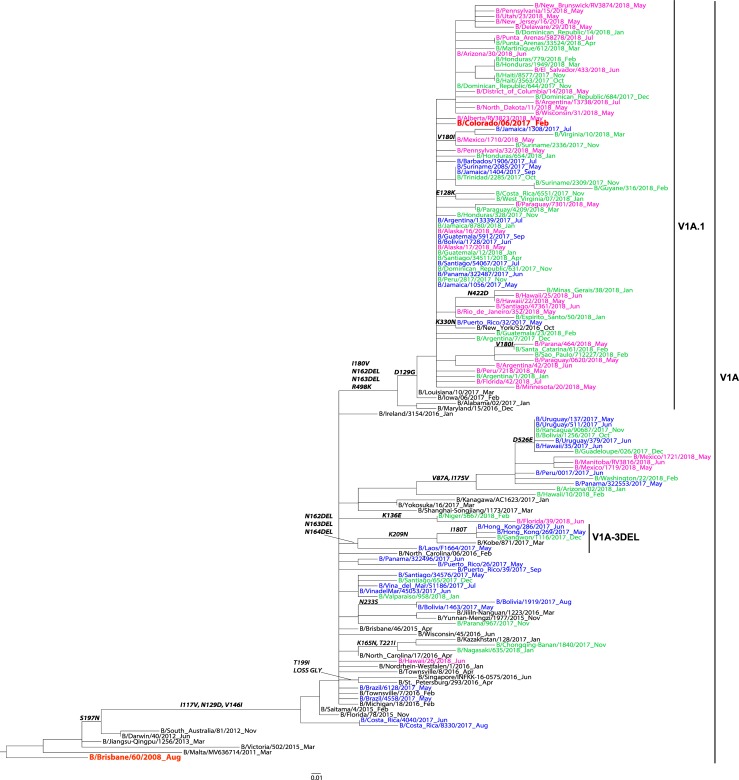
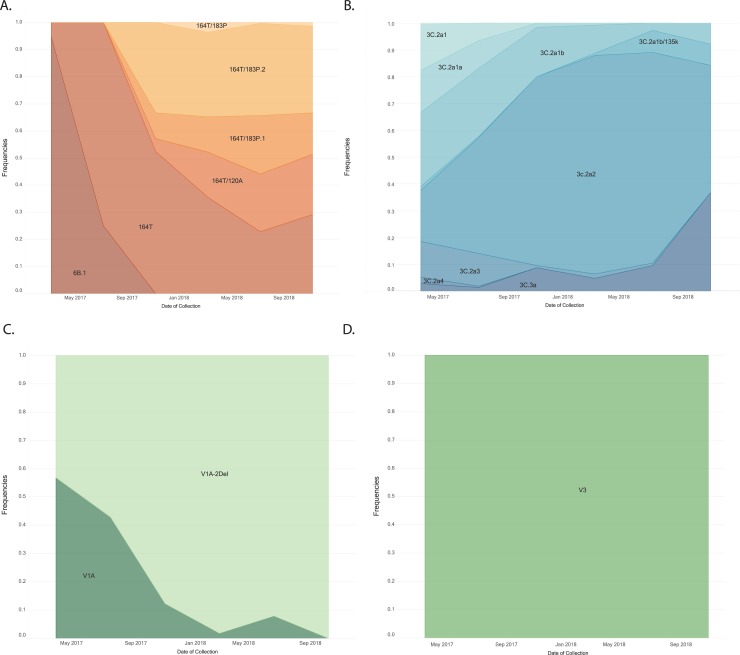
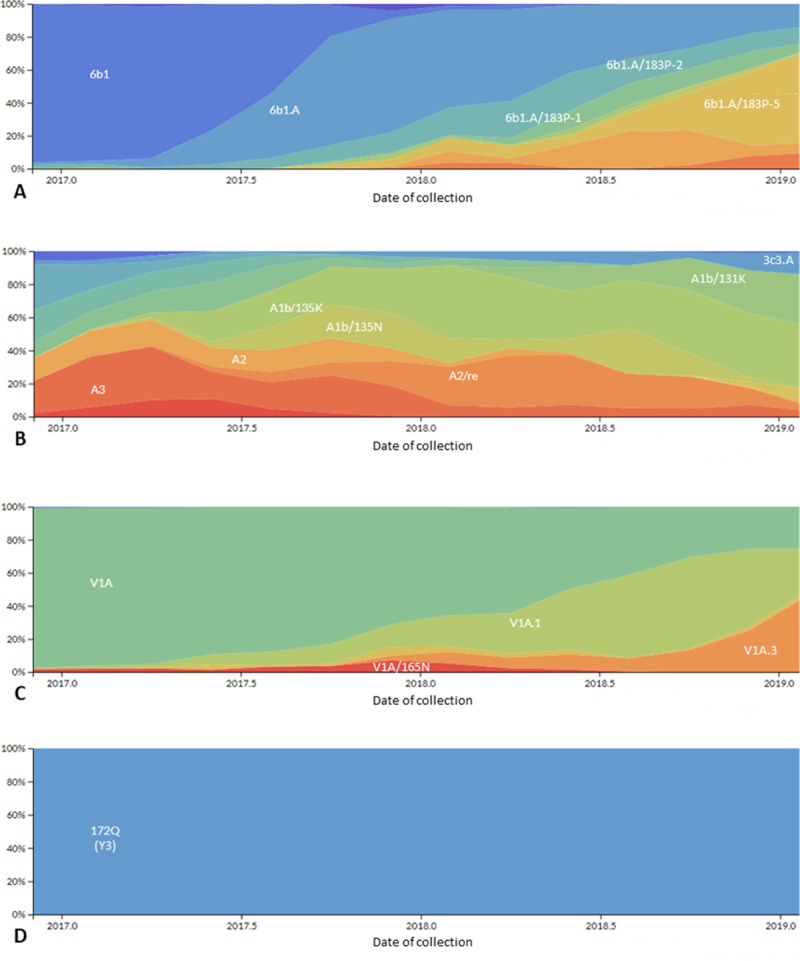
Methods: We analyzed influenza A/H1pdm09, A/H3, B/Victoria and B/Yamagata hemagglutinin sequences from clinical samples from 12 National Influenza Centers (NICs) in ten countries (Argentina, Brazil, Chile, Colombia, Costa Rica, Ecuador, Mexico, Paraguay, Peru and Uruguay) with a collection date from epidemiologic week (EW) 18, 2017 through EW 43, 2018. These sequences were generated by the NIC or the WHO Collaborating Center (CC) at the U.S Centers for Disease Control and Prevention, uploaded to the Global Initiative on Sharing All Influenza Data (GISAID) platform, and used for phylogenetic reconstruction.

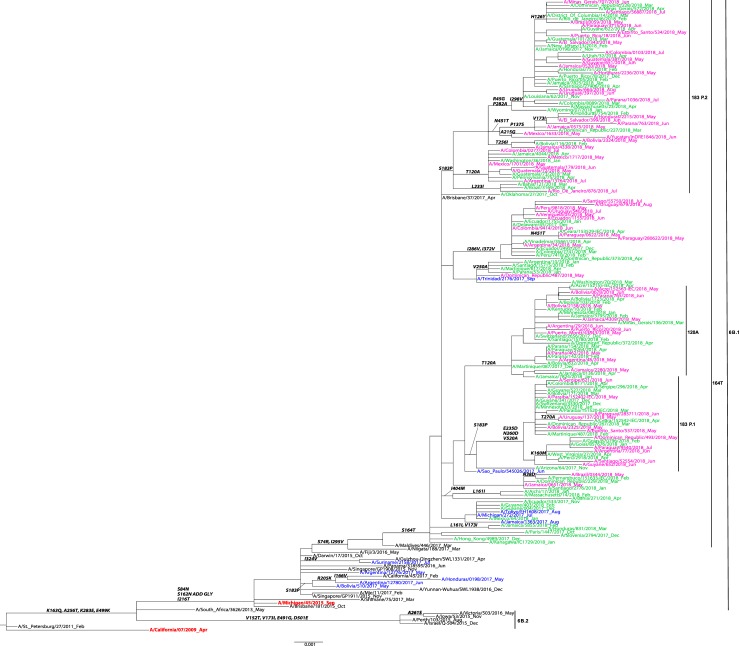
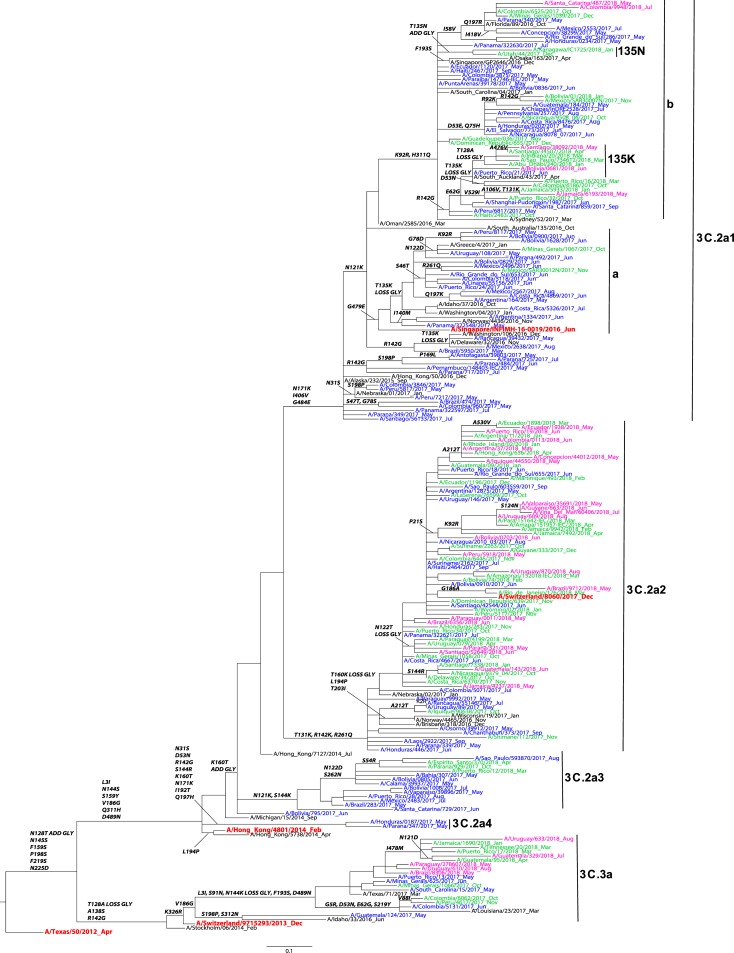
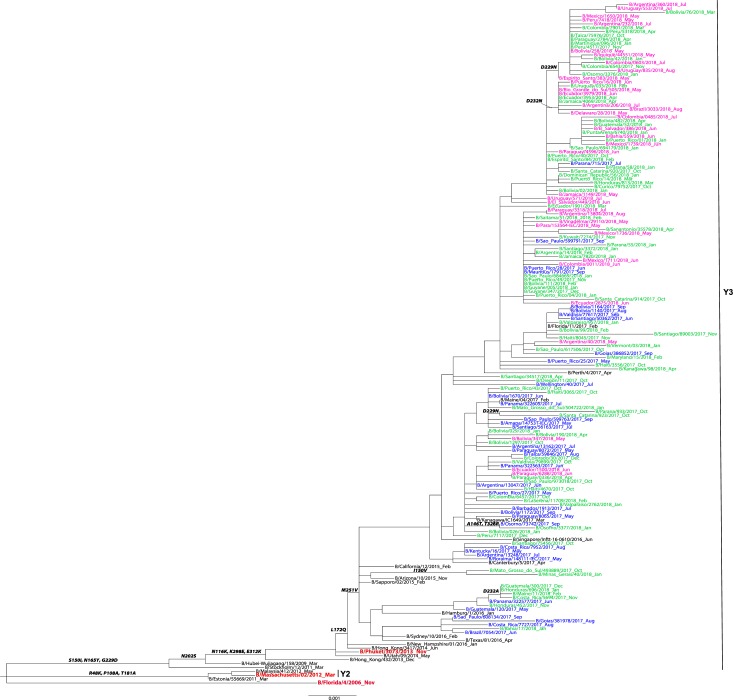
Findings: Influenza hemagglutinin sequences from the participating countries (A/H1pdm09 n = 326, A/H3 n = 636, B n = 433) were highly concordant with the genetic groups of the influenza vaccine-recommended viruses for influenza A/H1pdm09 and influenza B. For influenza A/H3, the concordance was variable.

Conclusions: Considering the constant evolution of influenza viruses, high-quality surveillance data-specifically genetic sequence data, are important to allow public health decision makers to make informed decisions about prevention and control strategies, such as influenza vaccine composition. Countries that conduct influenza genetic sequencing for surveillance in LA should continue to work with the WHO CCs to produce high-quality genetic sequence data and upload those sequences to open-access databases.


Conflict of interest statement

The authors have declared that no competing interests exist.

Figures

Fig 1
Fig 1. Patterns of influenza circulation among selected countries in Latin America a, epidemiologic weeks 18, 2017 through 43, 2018.
aArgentina, Brazil, Chile, Colombia, Costa Rica, Ecuador, Mexico, Paraguay, Peru, and Uruguay.
Fig 2
Fig 2. Representative maximum-likelihood tree of n = 139 influenza A (H1N1)pdm09 hemagglutinin (HA) gene sequences from Mexico, South and Central America; sequences from the current and previous vaccine strains (in red) and reference viruses detected worldwide indicated by the CDC WHO CC.
HA sequences of influenza viruses collected from May to September 2017 are in blue, October 2017 to April 2018 are in green, May to September 2018 are in pink. Sequences from the time period before the period of analysis, are in black. Amino acid changes and addition (ADD GLY) and loss (LOSS GLY) of glycosylation sites are indicated in bold in the branches.
Fig 3
Fig 3. Representative maximum-likelihood tree of n = 180 influenza A (H3N2) HA gene sequences from Mexico, South and Central America; sequences from the current and previous vaccine strains (in red) and reference viruses detected worldwide indicated by the CDC WHO CC.
HA sequences of influenza viruses collected from May to September 2017 are in blue, October 2017 to April 2018 are in green, May to September 2018 are in pink. Sequences from the time period before the period of analysis, are in black. Amino acid changes and addition (ADD GLY) and loss (LOSS GLY) of glycosylation sites are indicated in bold in the branches.
Fig 4
Fig 4. Representative maximum-likelihood tree n = 141 influenza B virus Yamagata HA gene sequences from in Mexico, South and Central America; sequences from the current and previous vaccine strains (in red) and reference viruses detected worldwide indicated by the CDC WHO CC.
HA sequences of influenza viruses collected from May to September 2017 are in blue, October 2017 to April 2018 are in green, May to September 2018 are in pink. Sequences from the time period before the period of analysis, are in black. Amino acid changes and addition (ADD GLY) and loss (LOSS GLY) of glycosylation sites are indicated in bold in the branches.
Fig 5
Fig 5. Representative maximum-likelihood tree of n = 76 influenza B virus Victoria HA gene sequences from Mexico, South and Central America; sequences from the current and previous vaccine strains (in red) and reference viruses detected worldwide indicated by the CDC WHO CC.
HA sequences of influenza viruses collected from May to September 2017 are in blue, October 2017 to April 2018 are in green, May to September 2018 are in pink. Sequences from the time period before the period of analysis, are in black. Amino acid changes and addition (ADD GLY) and loss (LOSS GLY) of glycosylation sites are indicated in bold in the branches.
Fig 6
Fig 6
Frequency of genetic groups of influenza viruses A/H1pdm09 (A), A/H3 (B), B/Victoria (C) and B/Yamagata (D) based upon hemagglutinin (HA) gene sequences from participating countries and other Latin American and Caribbean countries, May 1, 2017 through October 26, 2018.
Fig 7
Fig 7
Frequency of genetic groups of globally circulating influenza viruses A/H1pdm09 (A), A/H3 (B), B/Victoria (C) and B/Yamagata (D) based upon hemagglutinin (HA) gene sequences from May 1, 2017 through October 26, 2018 obtained through Next Strain (available at nexstrain.org/flu/seasonal), accessed September 19, 2019.

References

    1. Durand L, Cheng P, Palekar R, Clara W, Jara J, Cerpa M, et al. Timing of influenza epidemics and vaccines in the American tropics, 2002–2008, 2011–2014. Influenza Other Respir Viruses. 2016;10:170–5. 10.1111/irv.12371 - DOI - PMC - PubMed
    1. Sosa P, Couto P, Rodriguez A, Charles M, Leite J, Palekar R. Influenza and other respiratory virus surveillance systems in the Americas: 2017. Washington, DC: Pan American Health Organization; 2017. [cited 2019 Jan 15] Available from https://www.paho.org/hq/index.php?option=com_docman&view=download&catego...
    1. World Health Organization. WHO global epidemiological surveillance standards for influenza. 2014. [cited 2019 Jan 15] Available from: http://www.who.int/influenza/resources/documents/WHO_Epidemiological_Inf...
    1. Pan American Health Organization. Operational guidelines for sentinel severe acute respiratory infection (SARI) surveillance. 2014. [cited 2019 Jan 15] Available from: Operational Guidelines for Sentinel SARI Surveillance_v12: https://www.paho.org/revelac-i/wp-content/uploads/2015/10/2015-cha-opera...
    1. World Health Organization. National Influenza Centers. February 2019. [cited 2019 Jan 15] Available from https://www.who.int/influenza/gisrs_laboratory/national_influenza_centre...

MeSH terms

Substances