Population pharmacokinetic and exposure-response analysis of eptinezumab in the treatment of episodic and chronic migraine
- PMID: 32155317
- PMCID: PMC7064329
- DOI: 10.1002/prp2.567
Population pharmacokinetic and exposure-response analysis of eptinezumab in the treatment of episodic and chronic migraine
Abstract
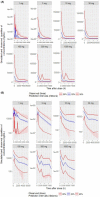
Eptinezumab is a humanized mAb that targets calcitonin gene-related peptide and is under regulatory review for the prevention of episodic and chronic migraine (EM, CM). It is important to determine whether exposures achieved with intravenous (IV) administration of eptinezumab achieve desired pharmacologic effects. Population pharmacokinetics, including dose- and exposure-response analyses, were performed using patient-level data from the eptinezumab clinical trial program with IV doses ranging from 10 to 1000 mg in pharmacokinetic analyses or 10 to 300 mg in phase 2/3 clinical studies in patients with EM or CM. Exposure-response analysis explored the relationship between eptinezumab exposure metrics and efficacy parameters including monthly migraine days. The pharmacokinetic profile of eptinezumab was characterized by rapid attainment of maximum plasma concentration (ie, end of IV administration) and a terminal half-life of 27 days. Covariate analysis found that patient characteristics had no clinically significant effects on pharmacokinetic parameters and were insufficient to influence dosing. Dose- and exposure-response analyses found exposure with single doses ≥100 mg was associated with greater efficacy compared with doses ≤30 mg and a plateau of effect between 100 and 300 mg. A saturable inhibitory Emax model found the exposure over 12 weeks produced by single-dose eptinezumab 100 and 300 mg exceeded the exposure estimates required to achieve 90% of the maximal efficacy (EC90 ). This pharmacokinetic analysis of eptinezumab supports dosing every 12 weeks with no adjustment for patient characteristics, including exposures associated with 100- or 300-mg doses producing optimal efficacy effects. The similar efficacy profiles support 100 mg as the lowest effective dose of eptinezumab.
Keywords: CGRP; calcitonin gene-related peptide; drug dose-response relationship; eptinezumab; intravenous administration; migraine disorders; monoclonal antibody; pharmacokinetics.
© 2020 The Authors. Pharmacology Research & Perspectives published by John Wiley & Sons Ltd, British Pharmacological Society and American Society for Pharmacology and Experimental Therapeutics.
Conflict of interest statement
BB, BS, SP, and JS are full‐time employees of Lundbeck Seattle BioPharmaceuticals. MB, IR, and MT have nothing to disclose. Within the past year, JS or an immediate family member held stock or stock options greater than 5% of the company or greater than $10 000 in value in Alder BioPharmaceuticals (now a part of H. Lundbeck A/S). JL and JS were full‐time employees of Alder BioPharmaceuticals (now known as Lundbeck Seattle BioPharmaceuticals) at the time of study.
Figures


References
-
- Schuster NM, Rapoport AM. Calcitonin gene‐related peptide‐targeted therapies for migraine and cluster headache: a review. Clin Neuropharmacol. 2017;40:169‐174. - PubMed
Publication types
MeSH terms
Substances
LinkOut - more resources
Full Text Sources
Research Materials

