. 2020 Apr 16;78(2):261-274.e5.
doi: 10.1016/j.molcel.2020.02.014. Epub 2020 Mar 9.

NELF Regulates a Promoter-Proximal Step Distinct from RNA Pol II Pause-Release

Affiliations

NELF Regulates a Promoter-Proximal Step Distinct from RNA Pol II Pause-Release

Yuki Aoi et al. Mol Cell. .

Abstract

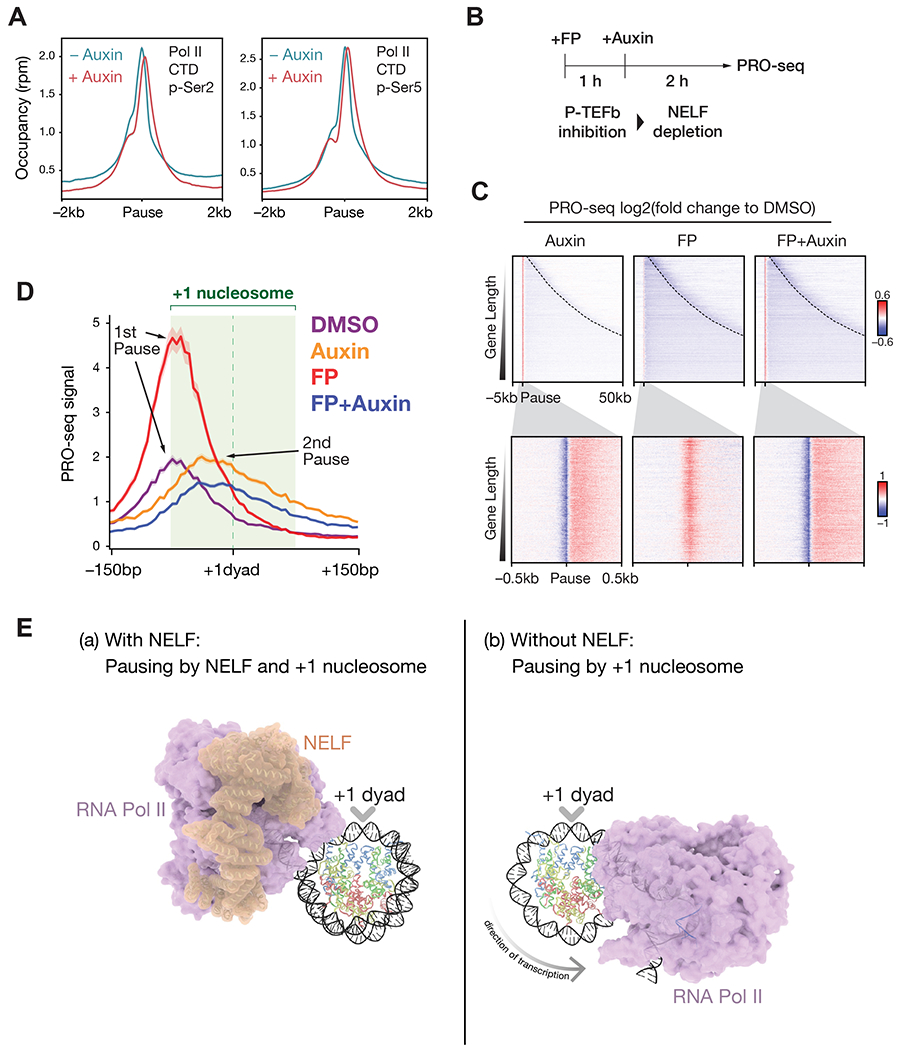
RNA polymerase II (RNA Pol II) is generally paused at promoter-proximal regions in most metazoans, and based on in vitro studies, this function has been attributed to the negative elongation factor (NELF). Here, we show that upon rapid depletion of NELF, RNA Pol II fails to be released into gene bodies, stopping instead around the +1 nucleosomal dyad-associated region. The transition to the 2nd pause region is independent of positive transcription elongation factor P-TEFb. During the heat shock response, RNA Pol II is rapidly released from pausing at heat shock-induced genes, while most genes are paused and transcriptionally downregulated. Both of these aspects of the heat shock response remain intact upon NELF loss. We find that NELF depletion results in global loss of cap-binding complex from chromatin without global reduction of nascent transcript 5' cap stability. Thus, our studies implicate NELF functioning in early elongation complexes distinct from RNA Pol II pause-release.

Keywords: NELF; PRO-cap; PRO-seq; RNA Polymerase II; cap-binding complex; m7G cap; mRNA capping; promoter-proximal pausing; super elongation complex; transcription elongation.


Conflict of interest statement

Declaration of Interests The authors declare no competing interests.

Figures

Figure 1.
Figure 1.. Acute NELF-C-AID degradation leads to loss of NELF complex on chromatin.
A. Schematic of auxin-inducible degradation of NELF-C-AID (upper panel). Western blots of whole cell extracts from NELF-C-AID or parental DLD-1 cells treated with auxin for the indicated times (lower panels). NELF-C is greatly depleted by 1 h. NELF-E and the DSIF subunit SPT5 are shown for comparison. Tubulin serves as a loading control. B. Growth curves of untreated or auxin-treated NELF-C-AID cells (bottom panel). Relative cell number was measured by crystal violet staining. Mean ± SD, n = 3. Representative cell staining at 96 h is shown (top panel). C. Genome browser track example of NELF-C, NELF-E, and SPT5 ChIP-seq in NELF-C-AID cells treated with or without auxin for 2 h. NELF-C loss leads to a concomitant loss of NELF-E on chromatin, while SPT5 occupancy is only partially reduced upon NELF-C loss. D. ChIP-seq metaplot shows NELF-C, NELF-E, and SPT5 average occupancies in untreated or 2 h auxin-treated NELF-C-AID cells, centered on Pol II pause regions. N = 6,531 genes with PRO-seq signal in the control condition (see methods).
Figure 2.
Figure 2.. NELF loss reveals a 2-step Pol II pausing at promoters.
A. Representative tracks of PRO-seq signal in NELF-C-AID cells treated with auxin for 0, 1, 4, 24 h at promoter regions of the SUV29H2, RAB8B, and FLCN genes. Scale bars, 50 bp. B. Metaplot analysis shows PRO-seq mean coverage at pause regions in auxin-treated NELF-C-AID cells. N = 6,531. C. The histogram shows base-pair distance between 1st and 2nd pause regions. Median is 49 bp change in pausing region. N = 6,531. D. Heatmap analysis of PRO-seq and NELF-C ChIP-seq in NELF-C-AID cells treated with auxin as in A. PRO-seq signal is shown as log2 fold change relative to 0 h. NELF-C ChIP-seq signal at 0 h is shown. Gene regions (pause −5kb to pause +50 kb) are sorted by gene length with dashed lines indicating transcription end sites (top panel). Promoter regions (pause ± 0.5 kb) are sorted by NELF-C signal (bottom panel). N = 6,531. E. Boxplots showing PRO-seq coverage (RPKM) at 1st pause region ± 5 bp, 2nd pause regions ± 5 bp, and gene bodies (1st pause region + 500 bp to + 100 kb or to transcription end sites). Genes with a low expression level (see Methods) are filtered out. N = 6,236. Whiskers, 1.5 times the interquartile range; boxes, the 25th and 75th percentiles. *P < 2.2 × 10⁻¹⁶ [Mann-Whitney U test]
Figure 3.
Figure 3.. The 2nd pause regions are associated with the +1 nucleosome.
A. Heatmaps of PRO-seq signal in auxin-treated NELF-C-AID cells shown alongside H3K4me3 ChIP-seq and MNase-seq signal in DLD-1 cells. Heatmaps are centered on promoter-proximal pause regions and are sorted by the distance to the 2nd pause region (pause ± 500 bp is shown). Log2 fold change of PRO-seq to 0 h is also shown. MNase-seq data from (Yamashita et al., 2011), accession number DRX000003. N = 6,531 (5,338 genes were classified as having a proximal 2nd pause region and 1,193 genes were classified as having a distal 2nd pause region). B. Metaplot showing MNase-seq mean signal centered on the 1st pause region. N = 5,338 genes with a proximal 2nd pause region. C. Metaplot of PRO-seq mean signal in auxin-treated NELF-C-AID cells, centered at the +1 nucleosomal dyad. The light green shading indicates the position of +1 nucleosome (+ 1 dyad ± 75 bp) as determined by MNase-seq. N = 1,843 genes that have a positioned +1 nucleosome among genes with a proximal 2nd pause (see methods).
Figure 4.
Figure 4.. P-TEFb-independent transition to 2nd pause region.
A. Metaplots of Pol II CTD phospho-Ser2 or phospho-Ser5 ChIP-seq signal centered on pause regions in NELF-C-AID cells treated with or without auxin for 2h. N = 6,531. B. Schematic showing the experimental design used for C and D. NELF-C-AID cells are treated with the P-TEFb inhibitor flavopiridol (FP) for 1 h followed by auxin treatment for 2 h to deplete NELF on chromatin. C. Heatmaps of log2 fold changes of PRO-seq signal compared to the DMSO control are shown. Dashed lines in upper panels indicate transcription end sites. Rows are ordered by gene length. N = 6,531. D. Metaplot of PRO-seq mean signal in NELF-C-AID cells treated with flavopiridol and auxin, centered at the +1 nucleosomal dyad. The light green shading indicates the position of +1 nucleosome (+ 1 dyad ± 75 bp) as determined by MNase-seq. N = 1,843 genes that have a positioned +1 nucleosome among genes with a proximal 2nd pause (see methods). E. Proposed mechanism of Pol II pausing at promoters: (a) NELF and the +1 nucleosome cooperatively regulate pausing. NELF physically inhibits Pol II transcription while the +1 nucleosome (or perhaps factors associated with the +1 nucleosome) could serve as an additional mechanism of pausing. (b) NELF depletion allows Pol II to advance up to the +1 dyad in a P-TEFb-independent manner. P-TEFb activity is required for Pol II to traverse the nucleosome and proceed into productive elongation. Structures of Pol II transcribing through nucleosomes are adapted from (Kujirai et al., 2018). Structure of NELF-Pol II complex is adapted from (Vos et al., 2018b).
Figure 5.
Figure 5.. The heat shock response is robust in the absence of NELF.
A. Schematic showing the experimental design. NELF-C-AID cells are treated with auxin for 2 h followed by heat shock at 42 °C for 1 h before performing PRO-seq. B. Heatmaps of PRO-seq signal for heat shock-upregulated genes. Gene regions (pause −5kb to pause +50 kb) are sorted by gene length with dashed lines indicating transcription end regions (top panels). Promoter regions (pause ± 0.5 kb) are sorted by NELF-C signals (bottom panels). N = 258. C. Boxplot analysis of PRO-seq coverage (RPKM) in gene bodies (pause region + 500 bp to + 100 kb or to transcription end sites) in heat shock-upregulated genes. N = 258. Whiskers, 1.5 times the interquartile range; boxes, the 25th and 75th percentiles. n.s., P > 0.06. [Mann-Whitney U test] D. Heatmaps of PRO-seq signal for heat shock-downregulated genes shown as in B. N = 5334. E. Boxplot analysis of PRO-seq coverage (RPKM) for heat shock-downregulated genes shown as in C. N = 5,334. *P < 0.01 [Mann-Whitney U test] F. Metaplot of PRO-seq mean signal in NELF-C-AID cells treated with heat shock and auxin, centered at the +1 nucleosomal dyad. The light green shading indicates the position of the +1 nucleosome (+ 1 dyad ± 75 bp) as determined by MNase-seq. N = 1,490 genes that have a positioned +1 nucleosome among genes with a proximal 2nd pause in heat shock-downregulated genes.
Figure 6.
Figure 6.. NELF is required for recruitment of cap-binding complex.
A. Venn diagram showing overlap of peaks between NELF-C and CBP80 ChIP-seq. B. Scatter plot of CBP80 coverage versus NELF-C coverage at each promoter. R2 = 0.81 [Spearman’s rank correlation coefficient] C. Western blots for CBP80 using whole-cell extracts of NELF-C-AID cells treated with or without auxin for 2 h. D. ChIP-seq track examples for CBP80 and NELF-C in NELF-C-AID cells treated as in C. E. Metaplots of CBP80 ChIP-seq signal at pause regions in NELF-C-AID cells treated as in C. N = 6,531.
Figure 7.
Figure 7.. Analysis of nascent transcript capping in the absence of NELF.
A. Differential expression analysis of PRO-cap data in NELF-C-AID cells in untreated versus 2h auxin treated condition. Each dot indicates TSS identified from PRO-cap data (N = 96,565). Red dots indicate TSS with increased PRO-cap signals (N = 16,593, Padj < 0.05), and blue dots indicate TSS with decreased PRO-cap signals (N = 6,125, Padj < 0.05). B. Metaplots of PRO-cap (left panel) and PRO-seq (right panel) at Cap Up TSS in NELF-C-AID cells. C. Metaplots at Cap Down TSS as in B. D. Heatmaps of NELF-C, CBP80 and MNase-seq in NELF-C-AID cells. Upper panels show Cap Up TSS clusters (N = 9,614), and lower panels show Cap Down TSS cluters (N = 5,336). Rows are sorted by length of TSS clusters. E. Model of NELF function distinct from regulating release from promoter-proximal pausing. Please see the discussion for the details. Structures of CBC with the NELF-E C-terminal tail are adapted from (Schulze and Cusack, 2017).

References

    1. Adelman K, Kennedy MA, Nechaev S, Gilchrist DA, Muse GW, Chinenov Y, and Rogatsky I (2009). Immediate mediators of the inflammatory response are poised for gene activation through RNA polymerase II stalling. Proceedings of the National Academy of Sciences 106, 18207–18212. - PMC - PubMed
    1. Aida M, Chen Y, Nakajima K, Yamaguchi Y, Wada T, and Handa H (2006). Transcriptional pausing caused by NELF plays a dual role in regulating immediate-early expression of the junB gene. Molecular and Cellular Biology 26, 6094–6104. - PMC - PubMed
    1. Aiyar SE, Sun J-L, Blair AL, Moskaluk CA, Lu Y-Z, Ye Q-N, Yamaguchi Y, Mukherjee A, Ren D-M, Handa H, et al. (2004). Attenuation of estrogen receptor alpha-mediated transcription through estrogen-stimulated recruitment of a negative elongation factor. Genes & Development 18, 2134–2146. - PMC - PubMed
    1. Amleh A, Nair SJ, Sun J, Sutherland A, Hasty P, and Li R (2009). Mouse Cofactor of BRCA1 (Cobra1) Is Required for Early Embryogenesis. PLoS ONE 4, e5034–e5038. - PMC - PubMed
    1. Aprile-Garcia F, Tomar P, Hummel B, Khavaran A, and Sawarkar R (2019). Nascent-protein ubiquitination is required for heat shock–induced gene downregulation in human cells. Nat. Struct. Mol. Biol 26, 1–16. - PubMed

Publication types