. 2020 Mar 9;30(5):802-814.e8.
doi: 10.1016/j.cub.2019.12.067. Epub 2020 Feb 20.

Two MYB Proteins in a Self-Organizing Activator-Inhibitor System Produce Spotted Pigmentation Patterns

Affiliations

Two MYB Proteins in a Self-Organizing Activator-Inhibitor System Produce Spotted Pigmentation Patterns

Baoqing Ding et al. Curr Biol. .

Abstract

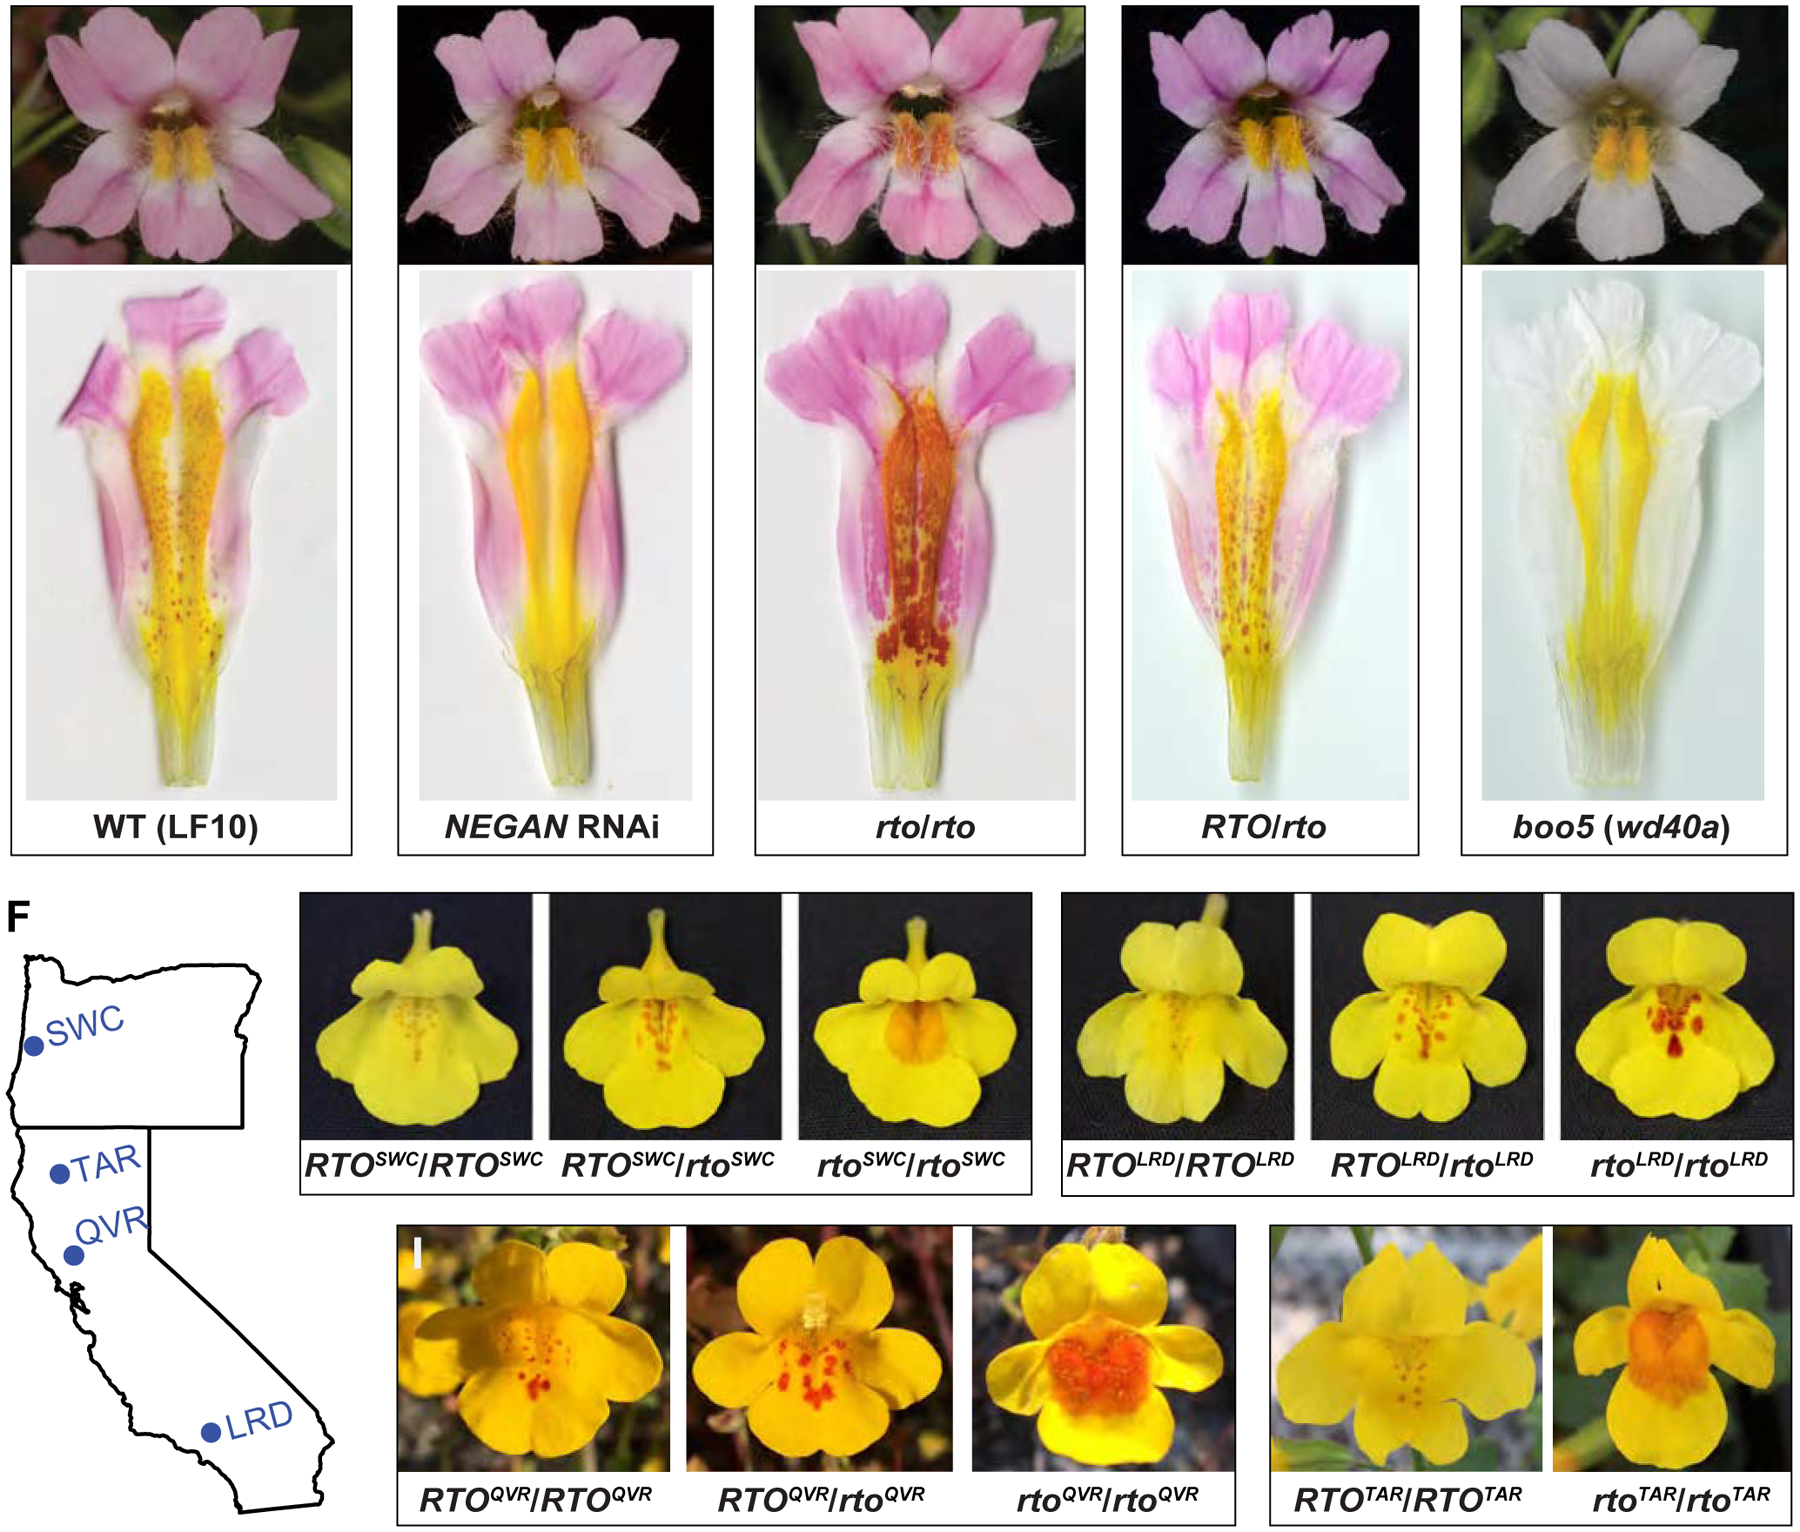
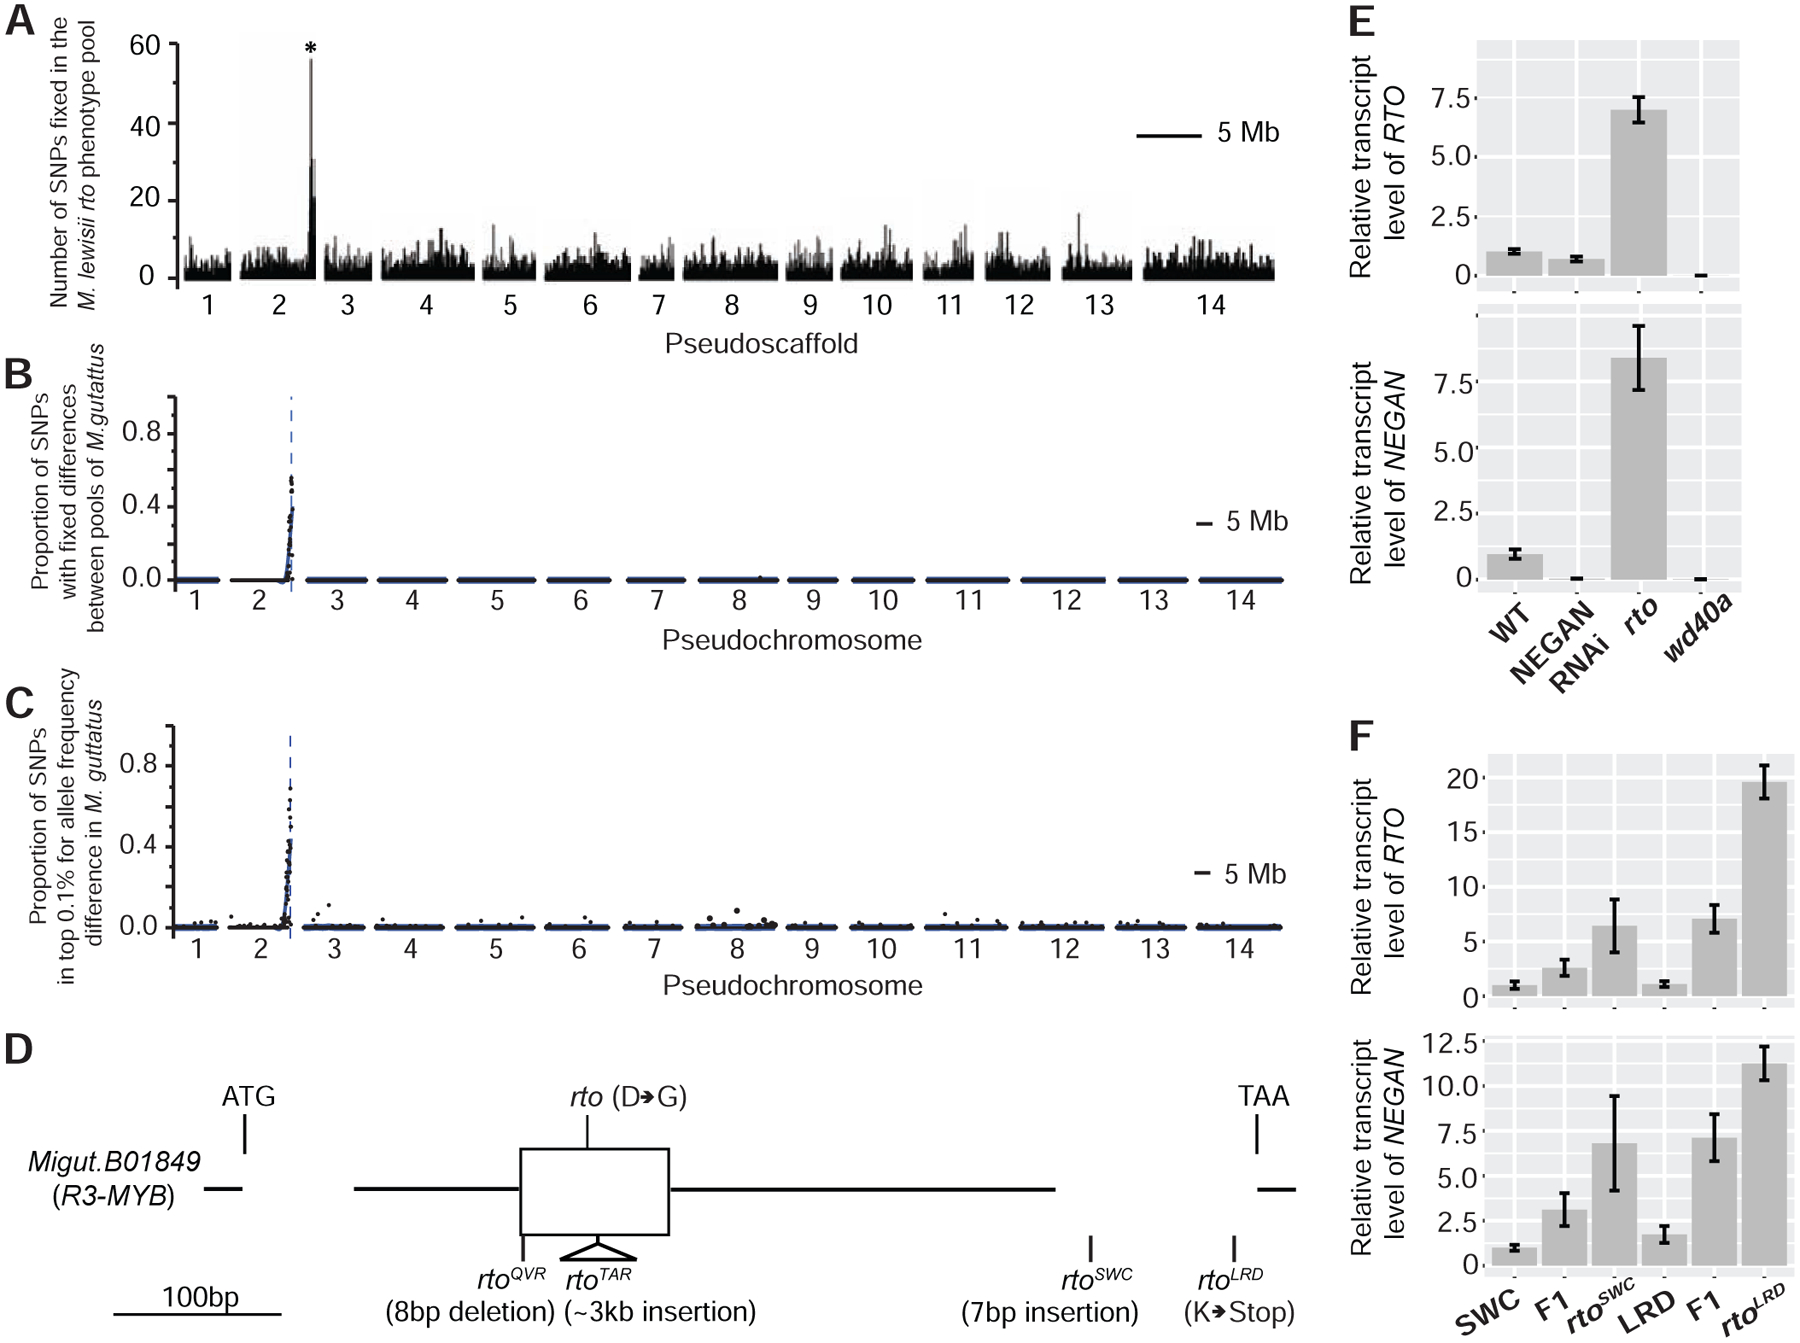
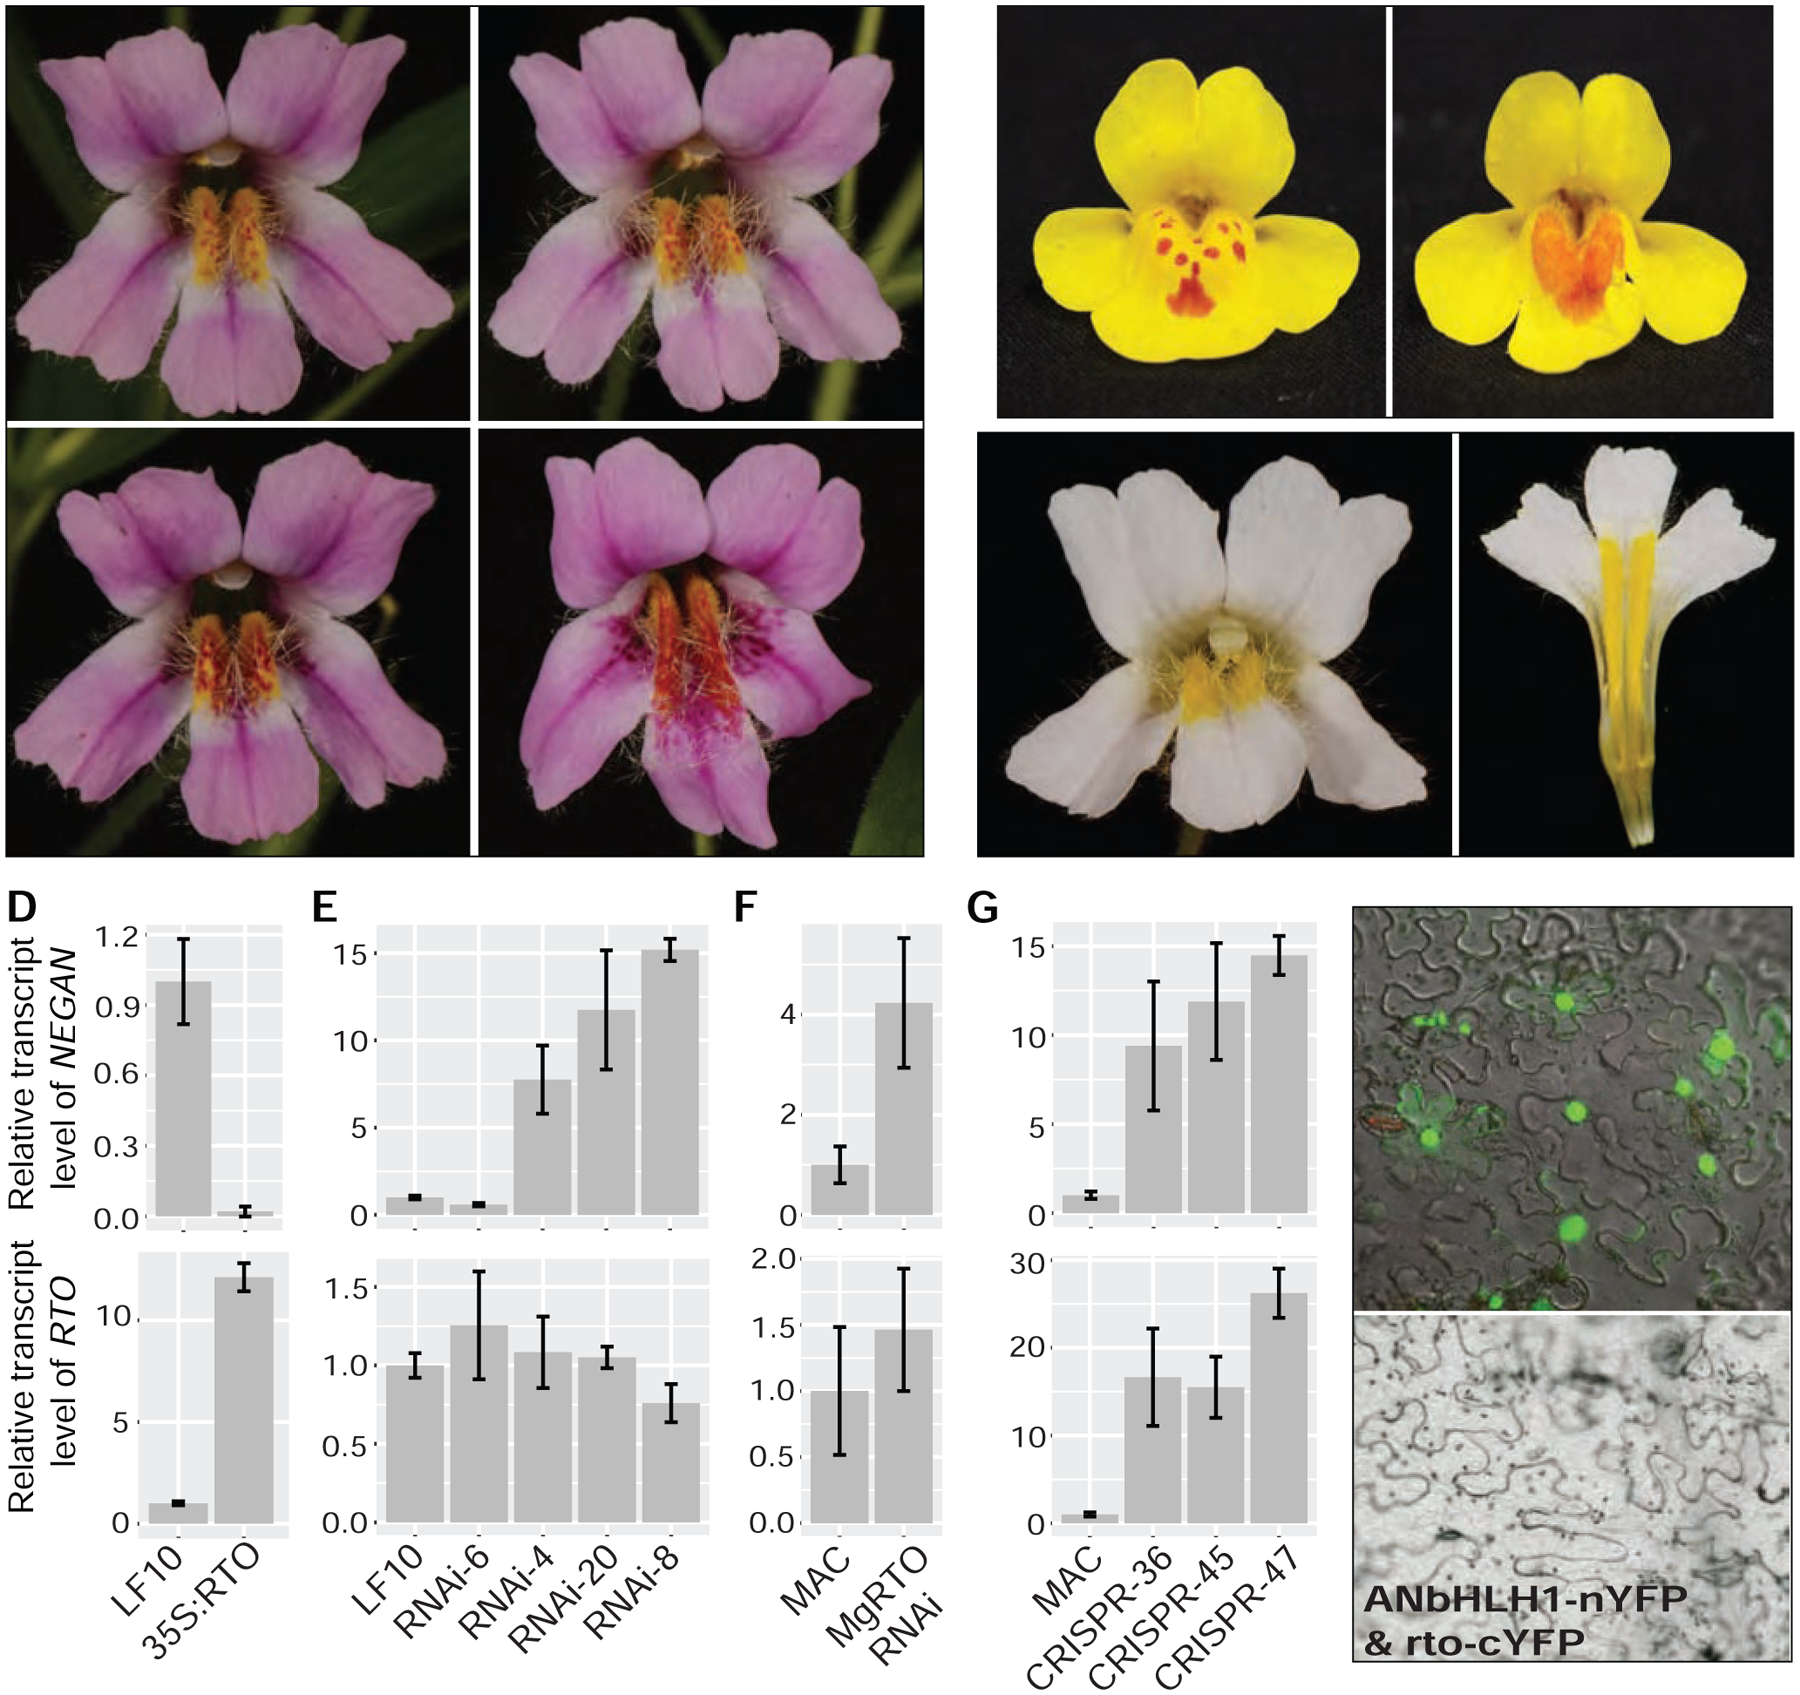
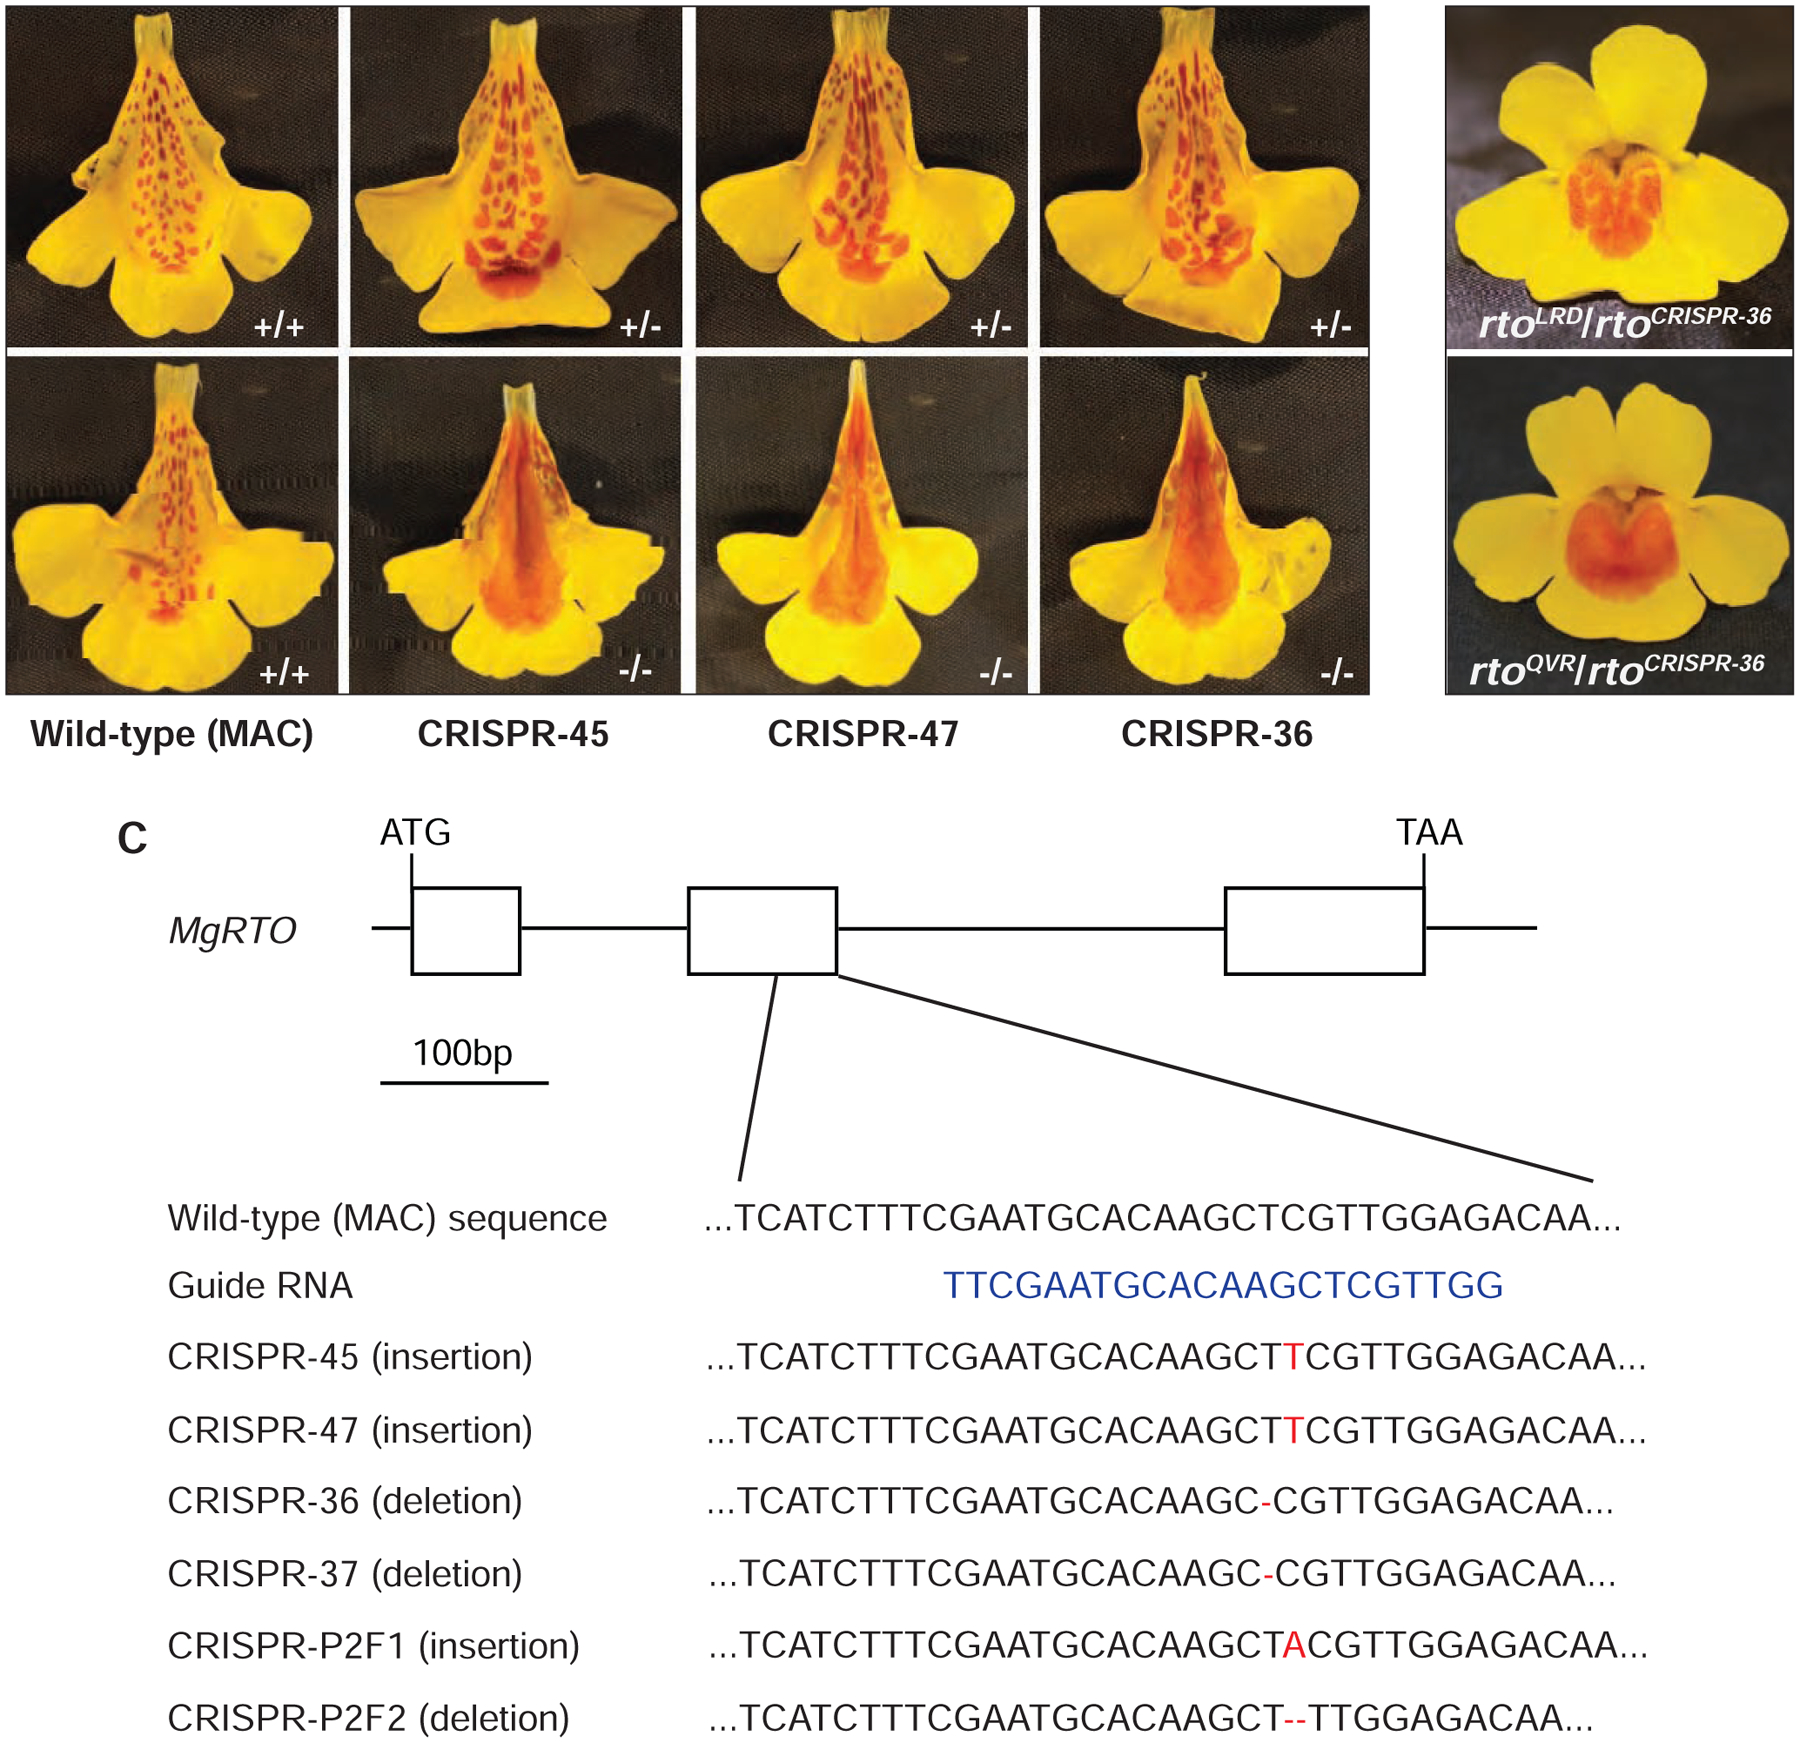
Many organisms exhibit visually striking spotted or striped pigmentation patterns. Developmental models predict that such spatial patterns can form when a local autocatalytic feedback loop and a long-range inhibitory feedback loop interact. At its simplest, this self-organizing network only requires one self-activating activator that also activates a repressor, which inhibits the activator and diffuses to neighboring cells. However, the molecular activators and inhibitors fully fitting this versatile model remain elusive in pigmentation systems. Here, we characterize an R2R3-MYB activator and an R3-MYB repressor in monkeyflowers (Mimulus). Through experimental perturbation and mathematical modeling, we demonstrate that the properties of these two proteins correspond to an activator-inhibitor pair in a two-component, reaction-diffusion system, explaining the formation of dispersed anthocyanin spots in monkeyflower petals. Notably, disrupting this pattern impacts pollinator visitation. Thus, subtle changes in simple activator-inhibitor systems are likely essential contributors to the evolution of the remarkable diversity of pigmentation patterns in flowers.

Keywords: Erythranthe; Mimulus; anthocyanin; developmental patterning; flower color; genome editing; monkeyflower; natural variation; pigmentation; reaction-diffusion.


Conflict of interest statement

Declaration of Interests The authors declare no competing interests.

Figures

Figure 1.
Figure 1.. Dispersed anthocyanin spots in Mimulus lewisii and M. guttatus.
(A–E) Anthocyanin spots on the yellow background of the wild-type M. lewisii (LF10) and various mutants and transgenic lines. D: dorsal; L: lateral; V: ventral. (F–J) Anthocyanin spot patterns of M. guttatus variants segregating in natural populations in Oregon and California. See also Figures S1 and S2.
Figure 2.
Figure 2.. Identification of the RTO gene in Mimulus lewisii and M. guttatus and its relative expression in various mutant and transgenic lines.
(A–C) Bulked segregant analyses of rto in M. lewisii (A) and rtoSWC (B) and rtoLRD (C) in M. guttatus narrowed RTO down to the same genomic interval. (D) Schematic of the RTO (R3-MYB) gene, showing the molecular lesions of the five mutant alleles. (E and F) Relative transcript level of RTO (upper) and NEGAN (lower) in M. lewisii (E) and M. guttatus (F) as measured by qRT-PCR, standardized to the corresponding wild-type (LF10 for M. lewisii, SWC for M. guttatus). Error bars represent 1 SD from three biological replicates. See also Figures S3 and S4 and Tables S4 and S6.
Figure 3.
Figure 3.. Functional characterization of RTO in Mimulus lewisii and M. guttatus.
(A) RNAi of RTO in M. lewisii generates a range of anthocyanin spot patterns. (B) RNAi of MgRTO in M. guttatus recapitulates the rto-like phenotype. (C) Over-expression of RTO in M. lewisii abolishes anthocyanin production throughout the corolla. (D–G) Relative expression of NEGAN and RTO in M. lewisii RTO over-expression lines (D), M. lewisii RTO RNAi lines (E), M. guttatus RTO RNAi lines (F), and M. guttatus CRISPR/Cas9 mediated knockout lines (G). All relative transcript levels are measured by qRT-PCR, standardized to the corresponding wild-type (LF10 for M. lewisii, MAC for M. guttatus). Error bars represent 1 SD from three biological replicates. (H) BiFC assay shows that the wild-type RTO protein interacts with ANbHLH1, whereas the D>G amino acid replacement in the mutant rto protein abolishes or attenuates the interaction. See also Figures S2 and S4S6 and Tables S5 and S6.
Figure 4.
Figure 4.. CRISPR/Cas9 mediated knockout of MgRTO in Mimulus guttatus.
(A) Flower phenotypes of three independent CRISPR knockout lines in their heterozygous (+/−) and homozygous (−/−) conditions, compared to the wild-type (MAC; +/+). (B) Complementation crosses between a CRISPR allele (rtoCRISPR−36) and two natural mutant alleles (rtoLRD and rtoQVR). (C) Examples of six independent CRISPR alleles relative to gRNA position in MgRTO. The primer pair 5’-GTCTTCATATATTCCCATCTCTT-3’ and 5’-CGTGCTCGGTGTAAGTAACG-3’ was used for amplifying and sequencing the target region. See also Figure S2 and Table S5.
Figure 5.
Figure 5.. Intercellular movement of RTO in Mimulus lewisii.
(A) Spatial pattern of RTO promoter activity revealed by the RTOpro:CFP-ER construct. The same nectar guide area was imaged under bright light (left) and the green channel (center). The right image is an overlay between the left and the center. The yellow background under bright light is due to carotenoid pigments, and the anthocyanin spots are red. CFP fluorescence signal (i.e., the green spots in the green channel) foreshadows and co-localizes with anthocyanin production (red ovals). (B) F1 hybrids between RTOpro:CFP-ER line 25 (in the wild-type background) and RTOpro:YFP-RTO line 22 (in the rto background) bear flowers similar in anthocyanin phenotype to the non-transgenic RTO/rto heterozygote and reveal a broader spatial distribution of RTO protein (yellow) than RTO promoter activity (blue). (C) A series of still images from a time-lapse video taken every 30 seconds to track the movement of YFP-RTO from nucleus to cytoplasm in 35S:YFP-RTO petal epidermal cells. See also Figure S6, Table S5, and Video S1.
Figure 6.
Figure 6.. Computer simulation of the anthocyanin spot patterning.
(A) Schematic illustration of a two-component activator-inhibitor model, modified from ref. . A: activator; I: inhibitor; DA and DI: diffusion coefficient of the activator and inhibitor, respectively; UA and UI: degradation rates; A0 and I0: background production rates; GA and GI: potency of the activation by the activator. The specific equations are described in the Methods. (B) Simulated pattern resembling the wild-type M. lewisii, with the following parameter values: DA = 0.01; DI = 0.5; UA = 0.03; UI = 0.03; A0 = 0.01; I0 = 0; GA = 0.08; GI = 0.12; (C-P) Simulated patterns that mimic NEGAN RNAi (C and I–L), RTO over-expression (D and M–P), and RTO RNAi lines (E–H). All parameter values are the same as in the wild-type condition (B), except one modification for each perturbation as shown on the lower left corner of each panel. Real flower images of the center of the nectar guides from the corresponding lines are shown on the lower right corner of panel B–H. See also Figure S7.

Comment in

References

    1. Hughes KA, Houde AE, Price AC, and Rodd FH (2013). Mating advantage for rare males in wild guppy populations. Nature 503, 108–110. - PubMed
    1. Porter SS (2013). Adaptive divergence in seed color camouflage in contrasting soil environments. New Phytol. 197, 1311–1320. - PubMed
    1. Salis P, Lorin T, Laudet V, and Frédérich B (2019). Magic Traits in Magic Fish: Understanding Color Pattern Evolution Using Reef Fish. Trends Genet. 35, 265–278. - PubMed
    1. Caro T, Izzo A, Reiner RC Jr, Walker H, and Stankowich T (2014). The function of zebra stripes. Nat. Commun 5, 3535. - PubMed
    1. Arnoult L, Su KFY, Manoel D, Minervino C, Magriña J, Gompel N, and Prud’homme B (2013). Emergence and Diversification of Fly Pigmentation Through Evolution of a Gene Regulatory Module. Science 339, 1423–1426. - PubMed

Publication types

MeSH terms