. 2020 Mar 6;12(3):608.
doi: 10.3390/cancers12030608.

Synthetic Lethality Screening Identifies FDA-Approved Drugs that Overcome ATP7B-Mediated Tolerance of Tumor Cells to Cisplatin

Affiliations

Synthetic Lethality Screening Identifies FDA-Approved Drugs that Overcome ATP7B-Mediated Tolerance of Tumor Cells to Cisplatin

Marta Mariniello et al. Cancers (Basel). .

Abstract

Tumor resistance to chemotherapy represents an important challenge in modern oncology. Although platinum (Pt)-based drugs have demonstrated excellent therapeutic potential, their effectiveness in a wide range of tumors is limited by the development of resistance mechanisms. One of these mechanisms includes increased cisplatin sequestration/efflux by the copper-transporting ATPase, ATP7B. However, targeting ATP7B to reduce Pt tolerance in tumors could represent a serious risk because suppression of ATP7B might compromise copper homeostasis, as happens in Wilson disease. To circumvent ATP7B-mediated Pt tolerance we employed a high-throughput screen (HTS) of an FDA/EMA-approved drug library to detect safe therapeutic molecules that promote cisplatin toxicity in the IGROV-CP20 ovarian carcinoma cells, whose resistance significantly relies on ATP7B. Using a synthetic lethality approach, we identified and validated three hits (Tranilast, Telmisartan, and Amphotericin B) that reduced cisplatin resistance. All three drugs induced Pt-mediated DNA damage and inhibited either expression or trafficking of ATP7B in a tumor-specific manner. Global transcriptome analyses showed that Tranilast and Amphotericin B affect expression of genes operating in several pathways that confer tolerance to cisplatin. In the case of Tranilast, these comprised key Pt-transporting proteins, including ATOX1, whose suppression affected ability of ATP7B to traffic in response to cisplatin. In summary, our findings reveal Tranilast, Telmisartan, and Amphotericin B as effective drugs that selectively promote cisplatin toxicity in Pt-resistant ovarian cancer cells and underscore the efficiency of HTS strategy for identification of biosafe compounds, which might be rapidly repurposed to overcome resistance of tumors to Pt-based chemotherapy.

Keywords: ATP7B; FDA-approved drugs; cancer; cisplatin resistance; copper transporters; synthetic lethality screening.


Conflict of interest statement

The authors declare no conflict of interest.

Figures
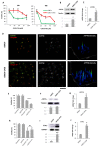
Figure 1
Figure 1
Cisplatin resistance of IGROV-CP20 cells requires ATP7B. (A) IGROV (green) and IGROV-CP20 (red) cells were treated with the indicated concentrations of cisplatin for 24 or 48 h and viability of the cells was then evaluated using the MTT assay. (B,F,I) Western blots (and corresponding density quantifications) show ATP7B (B), ATP7A (F), and CTR1 (I) protein levels in IGROV and IGROV-CP20 cells (n = 3 experiments; * p < 0.05, ** p < 0.01, t-test). (C,G,J) qRT-PCR shows ATP7B (C), ATP7A (G), and CTR1 (J) mRNA levels in IGROV and IGROV-CP20 cells (n = 3 experiments; * p < 0.05, t-test). (D) IGROV and IGROV-CP20 cells were labeled for ATP7B and Golgin-97. Graphs (right column) indicate higher levels of ATP7B signal in IGROV-CP20 cells respect to the parental line. (E) IGROV-CP20 cells were transfected with control (siControl) or ATP7B-specific siRNAs and incubated with 50 µM cisplatin. MTT assay show reduced tolerance to cisplatin in ATP7B-silenced cells (n = 3 experiments; ** p < 0.01, ANOVA). (H) IGROV-CP20 cells were transfected with control (siControl) or ATP7A-specific siRNAs and incubated with 50 µM cisplatin. MTT assay did not detect viability differences between control and ATP7A-silenced cells upon cisplatin treatment. Scale bar: 25 µm (D).
Figure 2
Figure 2
Synthetic lethality screening revealed FDA-approved drugs that promote platinum (Pt)-mediated death of IGROV-CP20 cells. (A) Heat maps showing the MTT signal (with blue indicating cell survival and white cell death) in two 384-well plates from the high-throughput screen (HTS). Sensitive IGROV cells were used as controls for cisplatin efficiency, while IGROV-CP20 cells were seeded in the central areas of each plate and treated with drugs from a library of 1280 FDA-approved molecules. For each set of drugs from the library one plate was treated with 50 µM cisplatin while the second plate with identical array of drugs was left without cisplatin. Drugs killing the cells only in combination with cisplatin were considered as the hits (red boxes), while drugs inducing cell death per se (black boxes) were excluded. (B) The panel shows the outcome of the screening. The average viability of IGROV-CP20 cells in cisplatin was considered as 0 (blue dash line). Standard deviation (SD) values of IGROV-CP20 cells in cisplatin were used to normalize the average MTT signal for each drug. Each drug, whose combination with cisplatin caused decrease in viability beyond an arbitrary threshold of 1.5 SDs (red dash line) was considered as a hit (red circle) if this drug did not induce toxicity without cisplatin. (C) The graph shows the percentage viability of IGROV-CP20 cells after treatment with the positive hits in combination with cisplatin (Pt) (n = 3 experiments; * p < 0.05, ** p < 0.01, ANOVA). (D) Quantification of MTT absorbance (as readout of viability) shows dose-response curves of Tranilast, Telmisartan, and Amphotericin B added to IGROV-CP20 cells with (red line) or without (blue line) 50 µM cisplatin. The blue dashed line shows viability in untreated cells, while the red dashed line shows viability in the cells treated with cisplatin alone. Data represent the average of six different experiments (* p < 0.05, ** p < 0.01, ANOVA).
Figure 3
Figure 3
FDA-approved drug hits promote cisplatin toxicity and stimulate DNA adduct formation in resistant IGROV-CP20 tumor cells. (A) Representative images of live/dead assay (see Section 4) showing the effect of 50 µM cisplatin (Pt) on the cell viability of IGROV or IGROV-CP20 cells, as indicated. Pretreatment with 10 µM Tranilast, Telmisartan, or Amphotericin B for 24 h increased cell death of IGROV-CP20 cells when combined with cisplatin. (B) Quantification of experiments shown in panel A reveals a significant decrease in viability of IGROV-CP20 cells treated with a mixture of cisplatin and indicated drugs (n = 10 fields; *** p < 0.001, ANOVA). (C) Pt adducts were evaluated via dot immuno-blot (see Section 4) with DNA samples from IGROV cells (above the dashed line) and IGROV-CP20 cells (below the dashed line), which were spotted as indicated in the membrane map (on the left). Two dot blot images demonstrate that cisplatin (Pt) in association with Tranilast, Telmisartan, or Amphotericin B induces a significant increase in the DNA adduct signal compared to the IGROV-CP20 treated with cisplatin alone (D) The graph shows quantification of the DNA adduct signal in dot blot experiments (n = 10 fields; ** p < 0.01, * p < 0.05, ANOVA). (E) Cells were treated as in panel A and prepared for ICP-MS (see Section 4) to evaluate intracellular platinum levels. Only the combination of Amphotericin B with cisplatin led to an increase in the overall platinum levels in the cells. Sensitive IGROV cells (green bars) were used as a positive control for cisplatin treatment. The Pt content of each specimen was normalized to the total cell numbers as nM of PT in 106 cells (n = 3 experiments; *** p < 0.001, ANOVA). Scale bar: 320 µM (A).
Figure 4
Figure 4
Impact of drug hits on expression of copper transporters and Pt-mediated trafficking of ATP7B in IGROV-CP20 cells. (AF) IGROV-CP20 cells were treated with 10 µM Tranilast, Telmisartan, or Amphotericin B for 24 h and then 50 µM cisplatin was added for 24 h. The cells were then prepared for qRT-PCR (A,C,E) or Western blot ((B,D,F); see also signal density quantification in each panel) to evaluate the expression of ATP7B (A,B), ATP7A (C,D), and CTR1 (E,F) (for each qRT-PCR and blot n = 3 experiments; * p < 0.05, ** p < 0.01, ANOVA). (G,H) The cells were treated with 10 µM Tranilast, Telmisartan, or Amphotericin B for 24 h and then exposed to 50 µM cisplatin for 4 h to activate ATP7B trafficking. Confocal images (G) show that the drugs promote ATP7B retention in the Golgi (labeled with Golgin-97) upon cisplatin treatment as also revealed by quantification of the ATP7B signal (H) in the Golgi region (n = 10 fields; ** p < 0.01, *** p < 0.001, ANOVA). Scale bar: 15 µm (G).
Figure 5
Figure 5
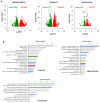
Impact of FDA-approved drugs on the transcriptome in cisplatin-treated IGROV-CP20 cells. (A) IGROV-CP20 cells were exposed for 24 h to 50 µM cisplatin either directly or 24 h after pretreatment with 10 µM Tranilast, Telmisartan, or Amphotericin B and prepared for QuantSeq analysis of mRNA (see Section 4). Volcano plot diagrams show down- and upregulated genes in IGROV-CP20 cells treated with the combination of the indicated drug and cisplatin compared to cisplatin alone. Data are expressed as Log of mRNA fold change. (B) The diagrams show GO enrichment analysis of genes whose expression was downregulated by Tranilast, Telmisartan, or Amphotericin B in cisplatin-treated cells. Pt-resistance pathways in common between at least two drugs are depicted with similar colors: DNA repair (green); protein quality control (blue); macroautophagy (cyan) and NFKB signaling (pink). Specific enrichment in downregulated copper ion binding genes (red bar) was detected only in Tranilast-treated cells.
Figure 6
Figure 6
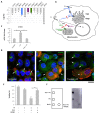
Impact of Tranilast on Pt-transporting pathways in cisplatin-resistant IGROV-CP20 cells. (A) QuantSeq analysis shows the impact of Tranilast on the expression of the copper ion binding genes in cisplatin-treated IGROV-CP20 cells (n = 3 experiments; * p < 0.05, ** p < 0.01, ANOVA). The genes playing a key role in the distribution of Pt across the cell (ATOX1, SOD1, and COX17) are shown in different colors corresponding to the specific intracellular route shown in panel B. (B) The scheme depicts Pt intracellular routes. Downregulation of ATOX1, SOD1, and COX17 by Tranilast (red crossbars) inhibits Pt delivery to the secretory pathway (blue arrows), mitochondria (green arrows), or SOD1-mediated detoxification pathway (magenta arrow). This favors delivery of Pt to the cell nucleus (dashed black arrow) leading to enhanced DNA damage. (C) qRT-PCR showed an increase in ATOX1 mRNA in cells treated with 50 µM cisplatin, while Tranilast inhibited Pt-mediated induction of ATOX1 expression (n = 3 experiments; ** p < 0.01, ANOVA). (D) IGROV-CP20 cells were transfected with pCDNA-ATOX1-FLAG and treated with 50 µM ciaplatin (Pt) or with a combination of 10 µM Tranilast and Pt (as indicated in the figure). The cells were then immuno-stained for ATP7B and FLAG. ATP7B was detected in the Golgi area in untreated cells (arrows, left panel) and at the cell surface and peripheral structures in Pt-treated cells (arrows, mid panel) regardless of ATOX1 overexpression. Tranilast blocked ATP7B in the Golgi area in Pt-treated cells, which did not overexpress ATOX1 (arrows, right panel), but failed to inhibit Pt-mediated redistribution of ATP7B from the Golgi in ATOX1-overexpressing cells (asterisks, right panel). (E) MTT viability assay was performed in cells treated with 50 µM cisplatin alone or in combination with 10 µM Tranilast (with and without ATOX1 overexpression). The plot shows that Tranilast did not reduce the viability of Pt-treated cells when ATOX1 is overexpressed (n = 3 experiments; ** p < 0.01, ANOVA). (F) Pt adducts were evaluated via dot immuno-blot of DNA samples spotted as indicated in the map on the left. Cisplatin (Pt) in association with Tranilast induced a significant increase in the DNA adduct signal compared to cells treated with cisplatin alone. ATOX1 overexpression inhibited the ability of Tranilast to promote DNA adduct formation in Pt-treated cells. Scale bar: 7 µm (D).

Similar articles

Cited by

References

    1. Siddik Z.H. Cisplatin: Mode of cytotoxic action and molecular basis of resistance. Oncogene. 2003;22 doi: 10.1038/sj.onc.1206933. - DOI - PubMed
    1. Galluzzi L., Senovilla L., Vitale I., Michels J., Martins I., Kepp O., Castedo M., Kroemer G. Molecular mechanisms of cisplatin resistance. Oncogene. 2012;31:1869–1883. doi: 10.1038/onc.2011.384. - DOI - PubMed
    1. Ishida S., Lee J., Thiele D.J., Herskowitz I. Uptake of the anticancer drug cisplatin mediated by the copper transporter Ctr1 in yeast and mammals. Proc. Natl. Acad. Sci. USA. 2002;99:14298–14302. doi: 10.1073/pnas.162491399. - DOI - PMC - PubMed
    1. Lee Y.Y., Choi C.H., Do I.G., Song S.Y., Lee W., Park H.S., Song T.J., Kim M.K., Kim T.J., Lee J.W., et al. Prognostic value of the copper transporters, CTR1 and CTR2, in patients with ovarian carcinoma receiving platinum-based chemotherapy. Gynecol. Oncol. 2011;122:361–365. doi: 10.1016/j.ygyno.2011.04.025. - DOI - PubMed
    1. Komatsu M., Sumizawa T., Mutoh M., Chen Z.S., Terada K., Furukawa T., Yang X.L., Gao H., Miura N., Sugiyama T., et al. Copper-transporting P-type adenosine triphosphatase (ATP7B) is associated with cisplatin resistance. Cancer Res. 2000;60:1312–1316. - PubMed