. 2020 Mar 6;9(3):647.
doi: 10.3390/cells9030647.

ABCA1/ABCB1 Ratio Determines Chemo- and Immune-Sensitivity in Human Osteosarcoma

Affiliations

ABCA1/ABCB1 Ratio Determines Chemo- and Immune-Sensitivity in Human Osteosarcoma

Dimas Carolina Belisario et al. Cells. .

Erratum in

Abstract

The ATP Binding Cassette transporter B1 (ABCB1) induces chemoresistance in osteosarcoma, because it effluxes doxorubicin, reducing the intracellular accumulation, toxicity, and immunogenic cell death induced by the drug. The ATP Binding Cassette transporter A1 (ABCA1) effluxes isopentenyl pyrophosphate (IPP), a strong activator of anti-tumor Vγ9Vδ2 T-cells. Recruiting this population may represent an alternative strategy to rescue doxorubicin efficacy in ABCB1-expressing osteosarcoma. In this work, we analyzed how ABCA1 and ABCB1 are regulated in osteosarcoma, and if increasing the ABCA1-dependent activation of Vγ9Vδ2 T-cells could be an effective strategy against ABCB1-expressing osteosarcoma. We used 2D-cultured doxorubicin-sensitive human U-2OS and Saos-2 cells, their doxorubicin-resistant sublines (U-2OS/DX580 and Saos-2/DX580), and 3D cultures of U-2OS and Saos-2 cells. DX580-sublines and 3D cultures had higher levels of ABCB1 and higher resistance to doxorubicin than parental cells. Surprisingly, they had reduced ABCA1 levels, IPP efflux, and Vγ9Vδ2 T-cell-induced killing. In these chemo-immune-resistant cells, the Ras/Akt/mTOR axis inhibits the ABCA1-transcription induced by Liver X Receptor α (LXRα); Ras/ERK1/2/HIF-1α axis up-regulates ABCB1. Targeting the farnesylation of Ras with self-assembling nanoparticles encapsulating zoledronic acid (NZ) simultaneously inhibited both axes. In humanized mice, NZ reduced the growth of chemo-immune-resistant osteosarcomas, increased intratumor necro-apoptosis, and ABCA1/ABCB1 ratio and Vγ9Vδ2 T-cell infiltration. We suggest that the ABCB1highABCA1low phenotype is indicative of chemo-immune-resistance. We propose aminobisphosphonates as new chemo-immune-sensitizing tools against drug-resistant osteosarcomas.

Keywords: ABCA1; ABCB1; Vγ9Vδ2 T-cells; doxorubicin resistance; osteosarcoma.


Conflict of interest statement

The authors declare no conflict of interest

Figures

Figure 1
Figure 1
3D cultures of U-2OS cells display an ABCB1highABCA1low phenotype. (A) Representative micro-photographs of U-2OS cells, U-2OS/DX580 cells, both grown as 2D cultures, and U-2OS cells grown in 3D culture (10× ocular lens, 4× objective). Bar: 100 μM. (B) Dot plots of ABCB1 and ABCA1 proteins on the cell surface, measured by flow cytometry in duplicates. The figure is representative of one out of three experiments. SSC: side scattering. Percentage of ABCB1- and ABCA1-positive cells, calculated as cells with a fluorescence >10 2 using the Incyte software. (C) Cells were grown for 72 h in medium containing 5 μM DMSO (vehicle) or doxorubicin (Dox). Percentage of viable cells, measured by a chemiluminescence-based assay in quadruplicates. Data are means ± SD (n = 4 independent experiments). * p < 0.001 for doxorubicin-treated cells vs. untreated cells; ° p < 0.001 for doxorubicin-treated 2D U-2OS/DX580 and 3D U-2OS cells vs. doxorubicin-treated 2D U-2OS cells. (D) Cells were labeled 1 h with [14C]-cholesterol and extensively washed. After 24 h, the [14C]-cholesterol collected in the supernatant, considered an index of cholesterol efflux, was measured by liquid scintillation in duplicates. Data are means ± SD (n = 3 independent experiments). * p < 0.001 for 2D U-2OS/DX580 and 3D U-2OS cells vs. 2D U-2OS cells. ABCB1: ATP Binding Cassette transporter B1; ACBA1: ATP Binding Cassette transporter A1.
Figure 2
Figure 2
ABCA1 effluxes isopentenyl pyrophosphate (IPP) and mediates the activation of Vγ9δ2 T-lymphocytes against osteosarcoma cells. (A) 2D U-2OS cells were transfected with a non-targeting (scrambled, scr) shRNA plasmid or with shRNAs targeting ABCA1 (sh). 3D U-2OS cells were transfected with an empty (em) vector or with an ABCA1-expression vector (over). Forty-eight hours after the transfection, the amount of ABCA1 was verified by immunoblotting. The β-tubulin expression was used as control of equal protein loading. The figure is representative of one out of three experiments. (B) Cells were treated as in (A). Forty-eight hours after the transfection, cells were labeled 1 h with [14C]-IPP and extensively washed. After 24 h, the [14C]-IPP collected in the supernatant, considered an index of IPP efflux, was measured by liquid scintillation. Data are means ± SD (n = 3 independent experiments). * p < 0.001 for sh 2D U-2OS vs. scr 2D U-2OS cells; ° p < 0.001 for em 3D U-2OS vs. scr 2D U-2OS cells; §p<0.001 for over 3D U-2OS vs. em 3D U-2OS cells. (C) The IPP efflux was measured in U-2OS cells, U-2OS/DX580 cells, both grown as 2D cultures, and U-2OS cells grown in 3D culture, as detailed at point (B), in duplicates. Data are means ± SD (n = 3 independent experiments). * p < 0.001 for 2D U-2OS/DX580 and 3D U-2OS vs. 2D U-2OS cells. (D) Vγ9δ2 T-lymphocytes were cultured overnight with 2D U-2OS, 2D U-2OS/DX580 and 3D U-2OS cells. The percentage of Annexin V/Propidium Iodide-positive cells was measured by flow cytometry, in duplicates. Data are means ± SD (n=3 independent experiments). * p < 0.001 for 2D U-2OS/DX580 and 3D U-2OS vs. 2D U-2OS cells.
Figure 3
Figure 3
ABCA1 is down-regulated by Ras/Akt/mTOR and restored by Liver X Receptor α (LXRα) activation in resistant osteosarcoma cells. 3D U-2OS cells were treated with sterile physiological solution (vehicle) or self-assembled nanoparticles encapsulating zoledronic acid (NZ), containing 1 μM zoledronic acid for 24 h. When indicated, the mTOR inhibitor Everolimus (RAD001) (RAD; 10 nM) or the LXRα activator TO901317 (TO; 100 nM) were added for 24 h. (A) Cells were radiolabeled 24 h with [3H]-acetate. The activity of farnesyl pyrophosphate synthase (FPPS), taken as an index of de novo synthesis of [3H]-FPP, was measured by thin-layer chromatography (TLC) separation and liquid scintillation, in duplicates. Data are means ± SD (n = 3 independent experiments). * p < 0.001 for NZ-treated vs. vehicle-treated cells. (B) Pull-down assay of GTP bound-Ras and immunoblotting of the indicated proteins in whole-cell extracts. The β-tubulin expression was used as control of equal protein loading. The figure is representative of one out of three experiments. (C) Immunoblotting of LXRα in nuclear extracts. The TBP expression was used as control of equal protein loading. The figure is representative of one out of three experiments. (D) LXRα binding to ABCA1 promoter, measured by chromatin immunoprecipitation (ChIP) in triplicates. Data are means ± SD (n = 3 independent experiments). *p < 0.001 for all treatments vs. vehicle-treated cells. (E) ABCA1 mRNA levels, measured by qRT-PCR in triplicates. Data are means ± SD (n = 3 independent experiments). * p < 0.001 for all treatments vs. vehicle-treated cells. (F) IPP efflux, measured after metabolic radiolabeling, in duplicates. Data are means ± SD (n = 3 independent experiments). * p < 0.001 for all treatments vs. vehicle-treated cells. G. Vγ9δ2 T-lymphocyte killing activity, measured as a percentage of Annexin V/Propidium Iodide-positive target cells, detected by flow cytometry, in duplicates. Data are means ± SD (n = 3 independent experiments). * p < 0.001 for all treatments vs. vehicle-treated cells.
Figure 4
Figure 4
ABCB1 is up-regulated by ERK1/2/HIF-1α axis in resistant osteosarcoma cells. 3D U-2OS cells were treated with sterile physiological solution (vehicle) or self-assembled nanoparticles encapsulating zoledronic acid (NZ), containing 1 μM zoledronic acid for 24 h. (A) Immunoblotting of the indicated proteins in whole-cell extracts. The β-tubulin expression was used as control of equal protein loading. The figure is representative of one out of three experiments. (B) Immunoblotting of HIF-1α in nuclear extracts. The TBP expression was used as control of equal protein loading. The figure is representative of one out of three experiments. (C) HIF-1α binding to ABCB1 promoter, measured by ChIP in triplicates. Data are means ± SD (n = 3 independent experiments). * p < 0.001 for NZ-treated cells vs. vehicle-treated cells. (D) ABCB1 mRNA levels, measured by qRT-PCR in triplicates. Data are means ± SD (n = 3 independent experiments). * p < 0.001 for NZ-treated cells vs. vehicle-treated cells. (E) Immunoblotting of the indicated proteins in whole-cell extracts. The β-tubulin expression was used as control of equal protein loading. The figure is representative of one out of three experiments.
Figure 5
Figure 5
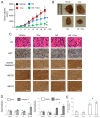
Self-assembled nanoparticles encapsulating zoledronic acid restores chemo-immune-sensitivity in vivo. U-2OS 3D cells (1 × 10⁶) were injected subcutaneously in Hu-CD34+ mice. When the tumor reached the volume of 50 mm3, animals (n = 8/group) were randomized and treated (on day 3, 9, and 15 after randomization) as it follows: 1) Vehicle group, treated with 0.1 ml saline solution intravenously (i.v.); 2) doxorubicin (Dox) group, treated with 5 mg/kg doxorubicin i.v.; 3) NZ group, treated with 20 μg/mice zoledronic acid i.v.; 4) NZ + Dox group, treated with 20 μg/mice zoledronic acid as NZ and 5 mg/kg doxorubicin i.v. (A) Tumor growth was monitored by caliper. * p < 0.01 for NZ-treated mice vs. vehicle-treated mice (days 15-21), * p < 0.001 for NZ + Dox-treated mice vs. vehicle-treated mice (days 9–21); ° p < 0.001 for NZ+Dox-treated mice vs. Dox-treated mice (days 9–21). (B) Representative photographs of tumors from each group of treatment. (C) Immunohistochemical analysis of tumor slices stained with hematoxylin-eosin (HE) or immunostained for the indicated proteins (63× objective). Bar = 10 μm. The microphotographs are representative of five tumors/each group. (D) The amount of Ki67, cleaved caspase 3, ABCB1, and ABCA1 positive cells were calculated using the Photoshop program. The staining intensity of the “Vehicle” group was considered 1. The staining intensity of the other groups was expressed as relative intensity staining vs. Vehicle group. * p < 0.01 for NZ-treated/NZ+Dox-treated cells vs. vehicle-treated cells. (E) Percentage of intratumor Vγ9δ2 T-lymphocytes vs. all CD3+T-lymphocyte-infiltrating cells, measured by flow cytometry. Data are means ± SD (n = 8 animals). * p < 0.001 for NZ-treated/NZ+Dox-treated cells vs. vehicle-treated cells.

References

    1. Szakács G., Hall M.D., Gottesman M.M., Boumendjel A., Kachadourian R., Day B.J., Baubichon-Cortay H., Pietro D.A. Targeting the Achilles heel of multidrug-resistant cancer by exploiting the fitness cost of resistance. Chem. Rev. 2014;114:5753–5774. doi: 10.1021/cr4006236. - DOI - PMC - PubMed
    1. Baldini N., Scotlandi K., Barbanti-Bròdano G., Manara M.C., Maurici D., Bacci G., Bertoni F., Picci P., Sottili S., Camapnacci M., et al. Expression of P-glycoprotein in high-grade osteosarcomas in relation to clinical outcome. N. Engl. J. Med. 1995;333:1380–1385. doi: 10.1056/NEJM199511233332103. - DOI - PubMed
    1. Serra M., Scotlandi K., Reverter-Branchat G., Ferrari S., Manara M.C., Benini S., Incaprera M., Bertoni F., Mercuri M., Briccoli A., et al. Value of P-glycoprotein and clinicopathologic factors as the basis for new treatment strategies in high-grade osteosarcoma of the extremities. J. Clin. Oncol. 2003;21:536–542. doi: 10.1200/JCO.2003.03.144. - DOI - PubMed
    1. Serra M., Pasello M., Manara M.C., Scotlandi K., Ferrari S., Bertoni F., Mercuri M., Alvegard T.A., Picci P., Bacci G., et al. May P-glycoprotein status be used to stratify high-grade osteosarcoma patients? Results from the Italian/Scandinavian Sarcoma Group 1 treatment protocol. Int. J. Oncol. 2006;29:1459–1468. doi: 10.3892/ijo.29.6.1459. - DOI - PubMed
    1. Hattinger C.M., Patrizio M.P., Magagnoli F., Luppi S., Serra M. An update on emerging drugs in osteosarcoma: Towards tailored therapies? Expert Opin. Emerg. Drugs. 2019;24:153–171. doi: 10.1080/14728214.2019.1654455. - DOI - PubMed

Publication types

MeSH terms

Substances