

Differential Impact of Calcium and Vitamin D on Body Composition Changes in Post-Menopausal Women Following a Restricted Energy Diet and Exercise Program
- PMID: 32156010
- PMCID: PMC7146554
- DOI: 10.3390/nu12030713
Differential Impact of Calcium and Vitamin D on Body Composition Changes in Post-Menopausal Women Following a Restricted Energy Diet and Exercise Program
Abstract
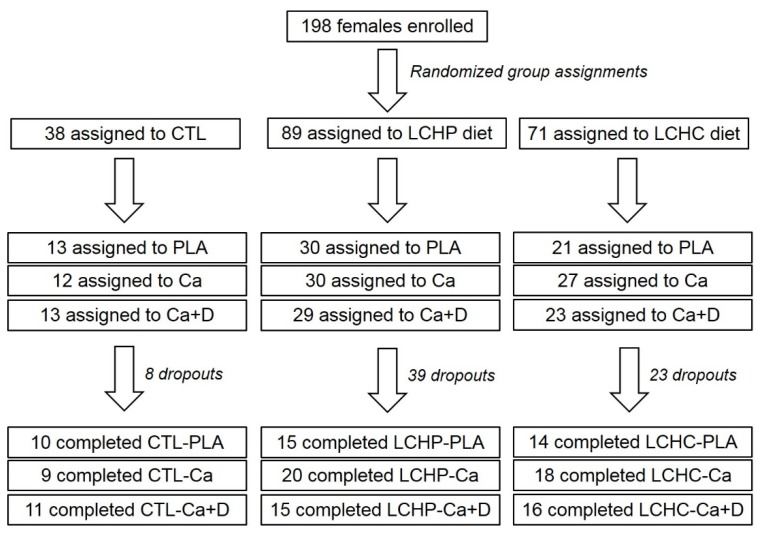
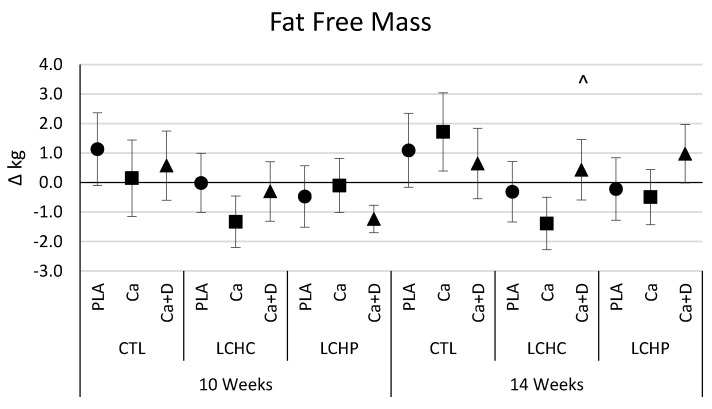
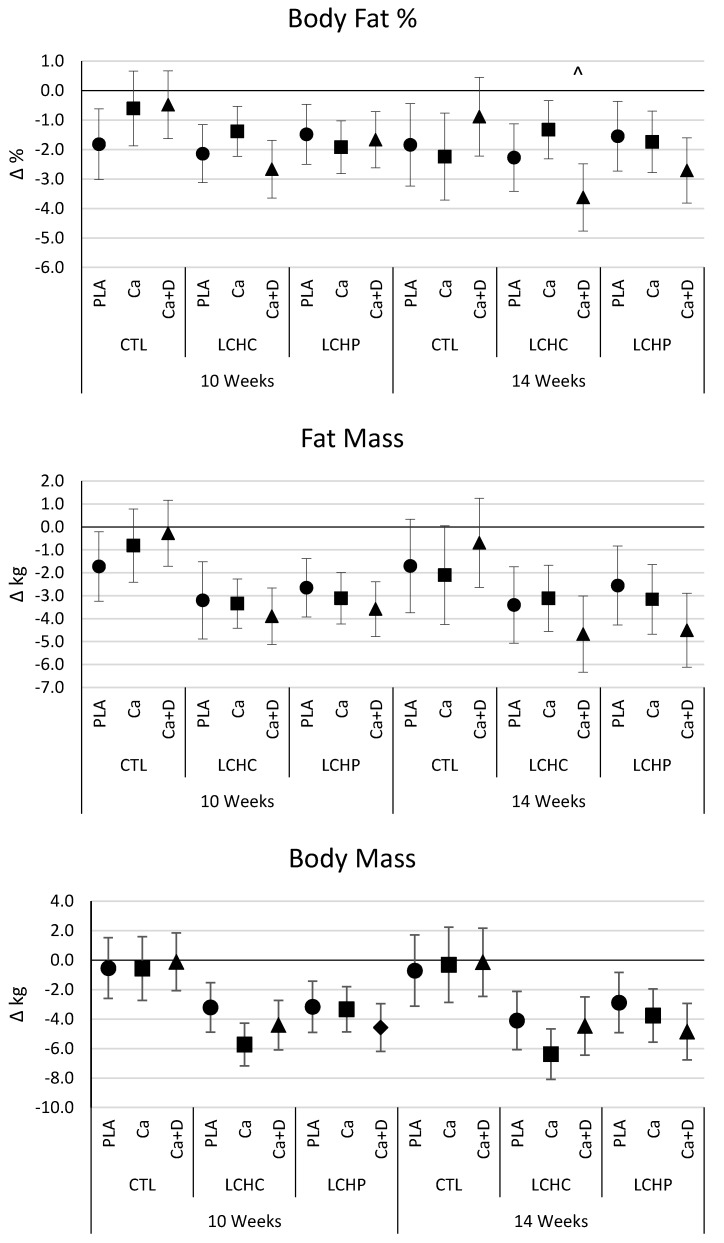
Vitamin D and calcium supplementation have been posited to improve body composition and different formulations of calcium may impact bioavailability. However, data are lacking regarding the combinatorial effects of exercise, diet, and calcium and/or vitamin D supplementation on body composition changes in post-menopausal women. Herein, 128 post-menopausal women (51.3 ± 4.5 years, 36.4 ± 5.7 kg/m2, 46.2 ± 4.5% fat) were assigned to diet and supplement groups while participating in a supervised circuit-style resistance-training program (3 d/week) over a 14-week period. Diet groups included: (1) normal diet (CTL), (2) a low-calorie, higher protein diet (LCHP; 1600 kcal/day, 15% carbohydrates, 55% protein, 30% fat), and (3) a low-calorie, higher carbohydrate diet (LCHC; 1600 kcal/day, 55% carbohydrates, 15% protein, 30% fat). Supplement groups consisted of: (1) maltodextrin (PLA), (2) 800 mg/day of calcium carbonate (Ca), and (3) 800 mg/day of calcium citrate and malate and 400 IU/day of vitamin D (Ca+D). Fasting blood samples, body composition, resting energy expenditure, aerobic capacity, muscular strength and endurance measures were assessed. Data were analyzed by mixed factorial ANOVA with repeated measures and presented as mean change from baseline [95% CI]. Exercise training promoted significant improvements in strength, peak aerobic capacity, and blood lipids. Dieting resulted in greater losses of body mass (CTL -0.4 ± 2.4; LCHC -5.1 ± 4.2; LCHP -3.8 ± 4.2 kg) and fat mass (CTL -1.4 ± 1.8; LCHC -3.7 ± 3.7; LCHP -3.4 ± 3.4 kg). When compared to LCHC-PLA, the LCHC + Ca combination led to greater losses in body mass (PLA -4.1 [-6.1, -2.1], Ca -6.4 [-8.1, -4.7], Ca+D -4.4 [-6.4, -2.5] kg). In comparison to LCHC-Ca, the LCHC-Ca+D led to an improved maintenance of fat-free mass (PLA -0.3 [-1.4, 0.7], Ca -1.4 [-2.3, -0.5], Ca+D 0.4 [-0.6, 1.5] kg) and a greater loss of body fat (PLA -2.3 [-3.4, -1.1], Ca -1.3 [-2.3, -0.3], Ca+D -3.6 [-4.8, -2.5]%). Alternatively, no significant differences in weight loss or body composition resulted when adding Ca or Ca+D to the LCHP regimen in comparison to when PLA was added to the LCHP diet. When combined with an energy-restricted, higher carbohydrate diet, adding 800 mg of Ca carbonate stimulated greater body mass loss compared to when a PLA was added. Alternatively, adding Ca+D to the LCHC diet promoted greater% fat changes and attenuation of fat-free mass loss. Our results expand upon current literature regarding the impact of calcium supplementation with dieting and regular exercise. This data highlights that different forms of calcium in combination with an energy restricted, higher carbohydrate diet may trigger changes in body mass or body composition while no impact of calcium supplementation was observed when participants followed an energy restricted, higher protein diet.
Keywords: dietary supplement; fat loss; training adaptations; weight loss.
Conflict of interest statement
Funding for this study was provided by Curves International (Waco, TX) through an unrestricted grant to Baylor University when the corresponding author (R.B.K.) was associated with that university. Investigators in the Exercise and Sport Nutrition Laboratory independently collected, analyzed and interpreted the results from this study and have no financial interests in the results of this study.
Figures
References
MeSH terms
Substances
Grants and funding
LinkOut - more resources
Full Text Sources
Other Literature Sources
Medical
