. 2020 Mar 11;287(1922):20192862.
doi: 10.1098/rspb.2019.2862. Epub 2020 Mar 11.

Disentangling functional trait variation and covariation in epiphytic lichens along a continent-wide latitudinal gradient

Affiliations

Disentangling functional trait variation and covariation in epiphytic lichens along a continent-wide latitudinal gradient

P Hurtado et al. Proc Biol Sci. .

Abstract

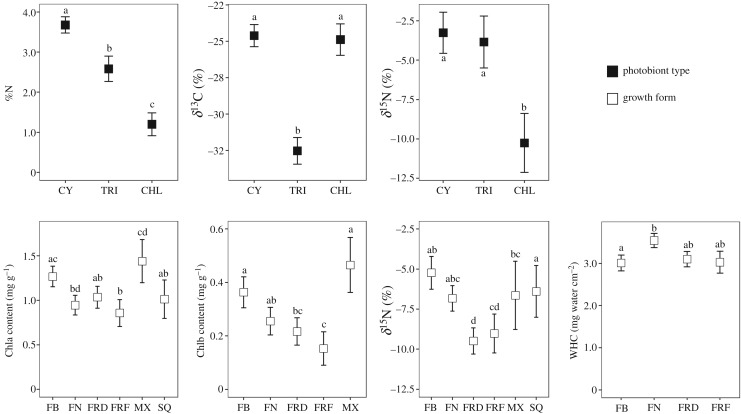
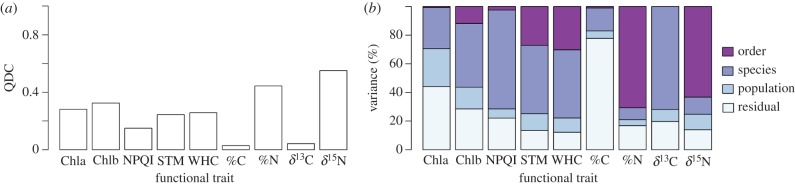
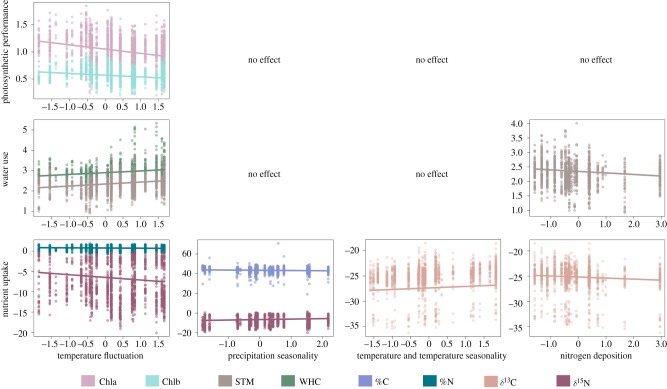
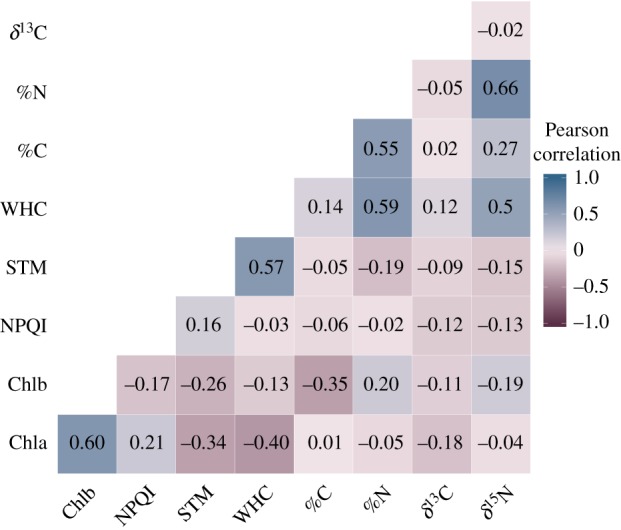
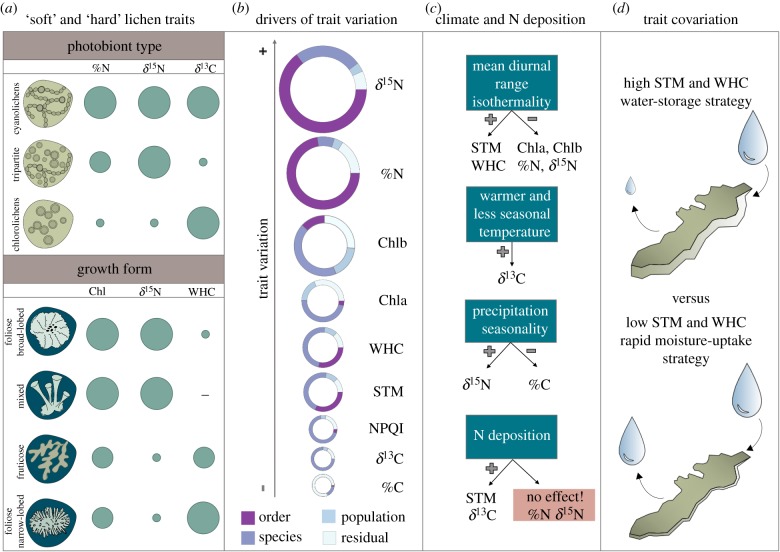
Characterizing functional trait variation and covariation, and its drivers, is critical to understand the response of species to changing environmental conditions. Evolutionary and environmental factors determine how traits vary among and within species at multiple scales. However, disentangling their relative contribution is challenging and a comprehensive trait-environment framework addressing such questions is missing in lichens. We investigated the variation in nine traits related to photosynthetic performance, water use and nutrient acquisition applying phylogenetic comparative analyses in lichen epiphytic communities on beech across Europe. These poikilohydric organisms offer a valuable model owing to their inherent limitations to buffer contrasting environmental conditions. Photobiont type and growth form captured differences in certain physiological traits whose variation was largely determined by evolutionary processes (i.e. phylogenetic history), although the intraspecific component was non-negligible. Seasonal temperature fluctuations also had an impact on trait variation, while nitrogen content depended on photobiont type rather than nitrogen deposition. The inconsistency of trait covariation among and within species prevented establishing major resource use strategies in lichens. However, we did identify a general pattern related to the water-use strategy. Thus, to robustly unveil lichen responses under different climatic scenarios, it is necessary to incorporate both among and within-species trait variation and covariation.

Keywords: climate seasonality; epiphytic lichens; functional trait variation; latitudinal gradient; phylogenetic comparative analysis.


Conflict of interest statement

We declare we have no competing interests

Figures

Figure 1.
Figure 1.
Differences of the functional trait values for different photobiont types (black squares) and growth forms (white squares). Squares represent the mean (± s.e.) derived from fitted phylogenetic least-squares (PGLS). Different letter(s) above the error bars denote significant differences of mean functional trait values between photobiont types or among growth forms accounting for the phylogeny. WHC was loge-transformed to meet normality. Sample size (number of species): cyanolichens (CY) = 15, tripartite lichens (TRI) = 2, chlorolichens (CHL) = 35, foliose broad-lobed (FB) = 23, foliose narrow-lobed (FN) = 11; fruticose dorsiventral (FRD) = 6, fruticose filamentous (FRF) = 6, mixed (MX) = 4 and squamulose (SQ) = 2. Traits: Chla, chlorophyll a content; Chlb, chlorophyll b content; WHC, water holding capacity; %N, nitrogen thallus content; δ13C, carbon isotopic ratio; δ15N, nitrogen isotopic ratio.
Figure 2.
Figure 2.
(a) Quartile coefficient of dispersion (QDC) and (b) variance partitioning across different scales for each functional trait. Trait variation explained by the order and species to which a thallus belongs is labelled as ‘order’ and ‘species’. ‘Population’ reflects the trait variation found among all thalli of a given species collected in different forests. ‘Residual’ indicates the variance among thalli collected in the same population. Chla and Chlb were sqrt-transformed, while STM, WHC and %N were loge-transformed to meet normality. Abbreviations: Chla, chlorophyll a content; Chlb, chlorophyll b content; NPQI, normalized phaeophytinization index; STM, specific thallus mass; WHC, water holding capacity; %C, carbon thallus content; %N, nitrogen thallus content; δ13C, carbon isotopic ratio; δ15N, nitrogen isotopic ratio. (Online version in colour.)
Figure 3.
Figure 3.
Response of lichen functional traits to climate and nitrogen deposition. Lines represent predicted regression lines of significant relationships (p < 0.05) between functional traits and climatic PCA axes and nitrogen deposition based on PGLMMs (electronic supplementary material, table S10). Temperature fluctuation reflects a gradient in mean diurnal range and isothermality (PCA axis RC3; electronic supplementary material, table S7). Temperature and temperature seasonality refer to warmer and less seasonal temperatures (PCA axis RC1; electronic supplementary material, table S7). Points illustrate raw data. Chla and Chlb were sqrt-transformed, while STM, WHC, %N and nitrogen deposition were loge-transformed to meet normality. Abbreviations follow figure 2. (Online version in colour.)
Figure 4.
Figure 4.
Trait correlation heat map for all the species (n = 52 for all traits except Chlb, n = 37, and STM and WHC, n = 44) accounting for phylogenetic relatedness. Numbers represent pairwise Pearson correlation between traits. STM and WHC were loge-transformed to meet normality. Abbreviations follow figure 2. (Online version in colour.)
Figure 5.
Figure 5.
Summary of the main results for the four proposed hypotheses. (a) ‘Soft’ functional traits (photobiont type and growth form) capture the variation of %N, δ15N, δ13C, Chl and WHC (circle area). (b) Circle area is proportional to the amount of trait variation and colours denote the contribution of different drivers to the overall variation accounted for each trait. (c) Effect of climate and nitrogen deposition on trait variation. (d) The positive covariation related to water-use strategies between STM and WHC was consistent among and within species. Abbreviations follow figure 2. (Online version in colour.)

References

    1. Violle C, Navas ML, Vile D, Kazakou E, Fortunel C, Hummel I, Garnier E. 2007. Let the concept of trait be functional! Oikos 116, 882–892. (10.1111/j.0030-1299.2007.15559.x) - DOI
    1. Reich PB, Wright IJ, Cavender-Bares J, Craine JM, Oleksyn J, Westoby M, Walters MB. 2003. The evolution of plant functional variation: traits, spectra, and strategies. Int. J. Plant Sci. 164, S143–S164. (10.1086/374368) - DOI
    1. Webb CT, Hoeting JA, Ames GM, Pyne MI, LeRoy Poff N. 2010. A structured and dynamic framework to advance traits-based theory and prediction in ecology. Ecol. Lett. 13, 267–283. (10.1111/j.1461-0248.2010.01444.x) - DOI - PubMed
    1. de Bello F, et al. 2010. Towards an assessment of multiple ecosystem processes and services via functional traits. Biodivers. Conserv. 19, 2873–2893. (10.1007/s10531-010-9850-9) - DOI
    1. Albert CH, Thuiller W, Yoccoz NG, Soudant A, Boucher F, Saccone P, Lavorel S. 2010. Intraspecific functional variability: extent, structure and sources of variation. J. Ecol. 98, 604–613. (10.1111/j.1365-2745.2010.01651.x) - DOI

Publication types

LinkOut - more resources