Asymptomatic neurotoxicity of amyloid β-peptides (Aβ1-42 and Aβ25-35) on mouse embryonic stem cell-derived neural cells
- PMID: 32156249
- PMCID: PMC7861624
- DOI: 10.17305/bjbms.2020.4639
Asymptomatic neurotoxicity of amyloid β-peptides (Aβ1-42 and Aβ25-35) on mouse embryonic stem cell-derived neural cells
Abstract
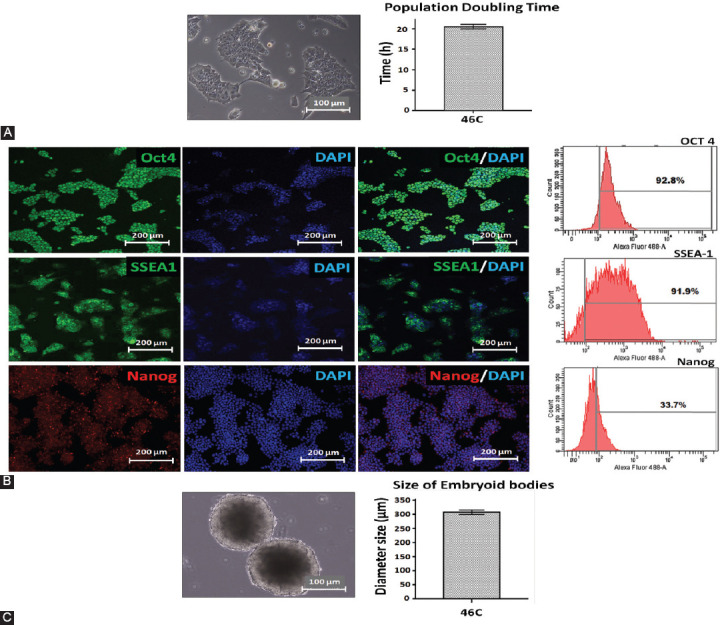
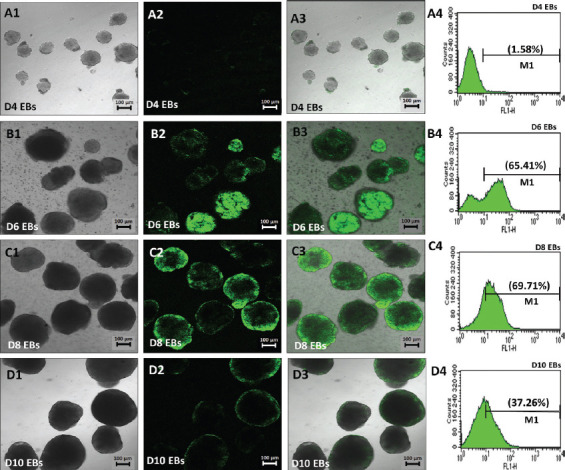
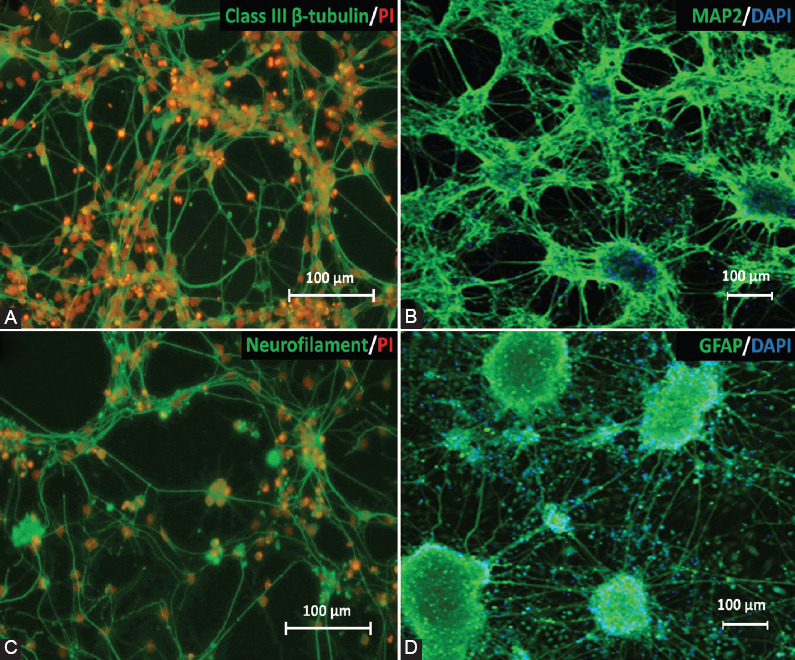
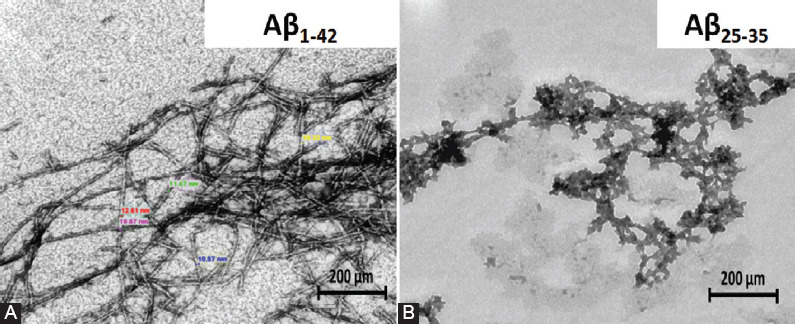
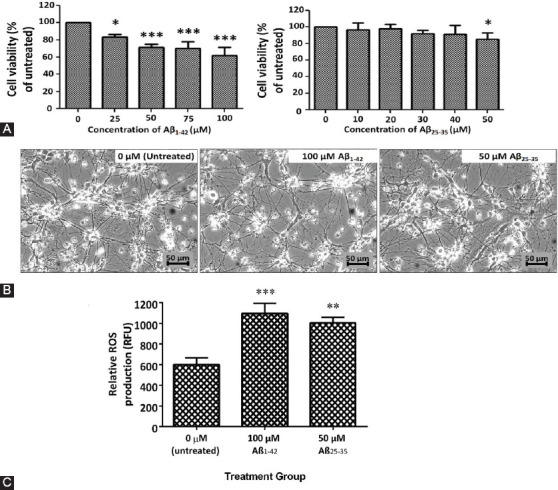
One of the strategies in the establishment of in vitro oxidative stress models for neurodegenerative diseases, such as Alzheimer's disease (AD), is to induce neurotoxicity by amyloid beta (Aβ) peptides in suitable neural cells. Presently, data on the neurotoxicity of Aβ in neural cells differentiated from stem cells are limited. In this study, we attempted to induce oxidative stress in transgenic 46C mouse embryonic stem cell-derived neurons via treatment with Aβ peptides (Aβ1-42 and Aβ25-35). 46C neural cells were generated by promoting the formation of multicellular aggregates, embryoid bodies in the absence of leukemia inhibitory factor, followed by the addition of all-trans retinoic acid as the neural inducer. Mature neuronal cells were exposed to different concentrations of Aβ1-42 and Aβ25-35 for 24 h. Morphological changes, cell viability, and intracellular reactive oxygen species (ROS) production were assessed. We found that 100 µM Aβ1-42 and 50 µM Aβ25-35 only promoted 40% and 10%, respectively, of cell injury and death in the 46C-derived neuronal cells. Interestingly, treatment with each of the Aβ peptides resulted in a significant increase of intracellular ROS activity, as compared to untreated neurons. These findings indicate the potential of using neurons derived from stem cells and Aβ peptides in generating oxidative stress for the establishment of an in vitro AD model that could be useful for drug screening and natural product studies.
Conflict of interest statement
Conflict of interest statement: The authors declare no conflict of interests
Figures
Similar articles
-
Incensole acetate prevents beta-amyloid-induced neurotoxicity in human olfactory bulb neural stem cells.Biomed Pharmacother. 2018 Sep;105:813-823. doi: 10.1016/j.biopha.2018.06.014. Epub 2018 Jun 15. Biomed Pharmacother. 2018. PMID: 29913410
-
Effect of (m)VD-hemopressin against Aβ1-42-induced oxidative stress and apoptosis in mouse hippocampal neurons.Peptides. 2020 Feb;124:170185. doi: 10.1016/j.peptides.2019.170185. Epub 2019 Nov 12. Peptides. 2020. PMID: 31730791
-
Dimeric bis (heptyl)-Cognitin Blocks Alzheimer's β-Amyloid Neurotoxicity Via the Inhibition of Aβ Fibrils Formation and Disaggregation of Preformed Fibrils.CNS Neurosci Ther. 2015 Dec;21(12):953-61. doi: 10.1111/cns.12472. Epub 2015 Oct 28. CNS Neurosci Ther. 2015. PMID: 26507365 Free PMC article.
-
Valproic acid attenuates Aβ25-35-induced neurotoxicity in PC12 cells through suppression of mitochondria-mediated apoptotic pathway.Biomed Pharmacother. 2018 Oct;106:77-82. doi: 10.1016/j.biopha.2018.06.080. Epub 2018 Jun 26. Biomed Pharmacother. 2018. PMID: 29957469
-
Amyloid beta-peptide (1-42)-induced oxidative stress and neurotoxicity: implications for neurodegeneration in Alzheimer's disease brain. A review.Free Radic Res. 2002 Dec;36(12):1307-13. doi: 10.1080/1071576021000049890. Free Radic Res. 2002. PMID: 12607822 Review.
Cited by
-
Unveiling the Therapeutic Potential of Kelulut (Stingless Bee) Honey in Alzheimer's Disease: Findings from a Rat Model Study.Antioxidants (Basel). 2024 Jul 30;13(8):926. doi: 10.3390/antiox13080926. Antioxidants (Basel). 2024. PMID: 39199172 Free PMC article.
-
Neuroprotective Effect of Solid Lipid Nanoparticles Loaded with Lepidium sativum (L.) Seed Bioactive Components Enhance Bioavailability and Wnt/β-Catenin/Camk-II Signaling Cascade in SH-SY5Y Neuroblastoma Cells.Nanomaterials (Basel). 2024 Jan 16;14(2):199. doi: 10.3390/nano14020199. Nanomaterials (Basel). 2024. PMID: 38251163 Free PMC article.
-
Primary Hypothyroidism and Alzheimer's Disease: A Tale of Two.Cell Mol Neurobiol. 2023 Oct;43(7):3405-3416. doi: 10.1007/s10571-023-01392-y. Epub 2023 Aug 4. Cell Mol Neurobiol. 2023. PMID: 37540395 Free PMC article. Review.
-
Kaempferia parviflora Extracts Protect Neural Stem Cells from Amyloid Peptide-Mediated Inflammation in Co-Culture Model with Microglia.Nutrients. 2023 Feb 22;15(5):1098. doi: 10.3390/nu15051098. Nutrients. 2023. PMID: 36904098 Free PMC article.
-
Photobiomodulation in Alzheimer's Disease-A Complementary Method to State-of-the-Art Pharmaceutical Formulations and Nanomedicine?Pharmaceutics. 2023 Mar 11;15(3):916. doi: 10.3390/pharmaceutics15030916. Pharmaceutics. 2023. PMID: 36986776 Free PMC article. Review.
References
-
- Terry RD. Alzheimer's disease and the aging brain. J Geriatr Psychiatry Neurol. 2006;19(3):125–8. https://doi.org/10.1177/089198∂291079. - PubMed
-
- Masters CL, Simms G, Weinman NA, Multhaup G, McDonald BL, Beyreuther K. Amyloid plaque core protein in Alzheimer disease and Down syndrome. Proc Natl Acad Sci U S A. 1985;82(12):4245–9. https://doi.org/10.1073/pnas.82.12.4245. - PMC - PubMed
-
- Irvine GB, El-Agnaf OM, Shankar GM, Walsh DM. Protein aggregation in the brain:The molecular basis for Alzheimer's and Parkinson's diseases. Mol Med. 2008;14(7-8):451–64. https://doi.org/10.2119/2007-00100.irvine. - PMC - PubMed
-
- Robakis NK, Wisniewski HM, Jenkins EC, Devine-Gage EA, Houck GE, Yao XL, et al. Chromosome 21q21 sublocalisation of gene encoding beta-amyloid peptide in cerebral vessels and neuritic (senile) plaques of people with Alzheimer disease and Down syndrome. Lancet. 1987;1(8529):384–5. https://doi.org/10.1016/s0140-6736(87)91754-5. - PubMed
-
- Glenner GG, Wong CW. Alzheimer's disease:Initial report of the purification and characterization of a novel cerebrovascular amyloid protein. Biochem Biophys Res Commun. 1984;120(3):885–90. https://doi.org/10.1016/s0006-291x(84)80190-4. - PubMed