

Improved RIDIT statistic approach provides more intuitive and informative interpretation of EQ-5D data
- PMID: 32156274
- PMCID: PMC7477837
- DOI: 10.1186/s12955-020-01313-3
Improved RIDIT statistic approach provides more intuitive and informative interpretation of EQ-5D data
Abstract
Background: EQ-5D is generic measure of health-related quality of life. Studies using EQ-5D generate ordinal data that are interpreted as categories ordered by severity. New analytic approaches taking into account the ordinal nature of the health dimension severity and leading to a better interpretation of EQ-5D data are needed to better elucidate differences in health-related quality of life. We propose utilizing the Improved RIDIT statistical method to analyze EQ-5D outcomes.
Methods: 556 Moroccan participants aged over 18 years representing four chronic diseases: back pain (n = 158), renal insufficiency (n = 56), diabetes (n = 82) or hypertension (n = 80) and healthy subjects (n = 180). All participants received the two EQ-5D versions. Two other published data sets were included. The first was extracted from a diabetic Spain study and the second was extracted from a clinical trial study. The Improved RIDIT analyses were carried out using an R statistic program we developed.
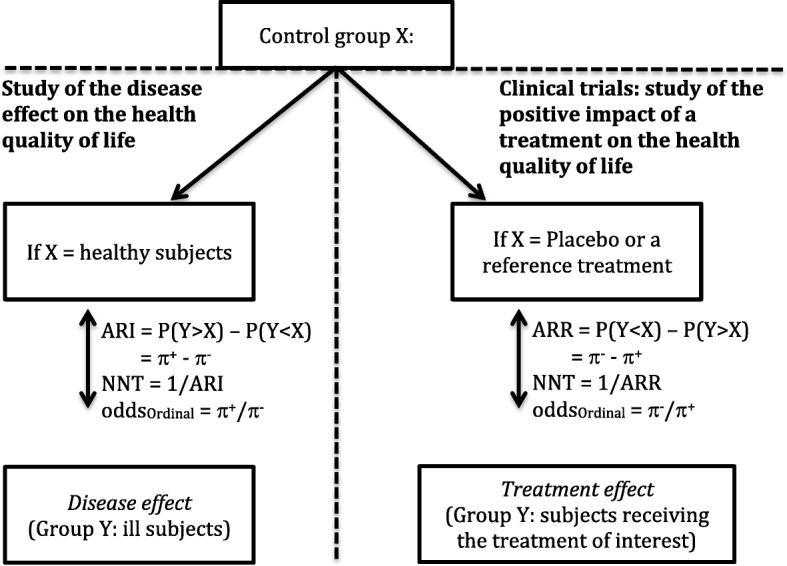
Results: Applying the Improved RIDIT on the EQ-5D data allowed estimating for the first time the ordinal odds, the Absolute Risk Reduction (ARR) or the Absolute Risk Increase (ARI) and the Number Needed to Treat. The ARI values estimated for Moroccan patients showed that (i) hypertension increased anxiety/depression by 66% and reduced mobility by 65%; (ii) back pain increased pain/discomfort by 69%; (iii) renal insufficiency impacts mobility (ARI = 57%, oddsordinal = 9.95) and usual activities (ARI = 44%, oddsordinal = 6.41) and (iv) diabetes acts only on anxiety/depression (ARI = 50%, oddsordinal = 4.8). Also, we demonstrated that the approach works well in clinical trials.
Conclusions: Improved RIDIT provides more intuitive and informative interpretation of the EQ-5D data by (1) taking into account the level severity; estimating (2) the odds ordinal, (3) the ARR/ARI and the NNT; (4) analyzing the five dimensions of the EQ-5D separately, which gives clinical teams more precision in understanding the treatment/pathology impacts on the health status and completes the EQ-5D data analysis based on score utilities.
Keywords: Absolute risk reduction; EQ-5D-3 L; EQ-5D-5 L; Improved RIDIT; Number needed to treat; Ordinal odds; Statistical analysis.
Conflict of interest statement
The authors declare that they have no competing interests.
Figures

Similar articles
-
Health-related quality of life among Moroccan women after vaginal birth and cesarean section: Cross-sectional study.Heliyon. 2024 May 31;10(11):e32276. doi: 10.1016/j.heliyon.2024.e32276. eCollection 2024 Jun 15. Heliyon. 2024. PMID: 38873689 Free PMC article.
-
An Excel program for calculating statistics presented in Marfak et al.'s article 'Improved RIDIT statistic approach provides more intuitive and informative interpretation of EQ-5D Data'.Health Qual Life Outcomes. 2021 Apr 5;19(1):113. doi: 10.1186/s12955-021-01745-5. Health Qual Life Outcomes. 2021. PMID: 33820569 Free PMC article.
-
Health-related quality of life during three trimesters of pregnancy in Morocco: cross-sectional pilot study.EClinicalMedicine. 2023 Feb 4;57:101837. doi: 10.1016/j.eclinm.2023.101837. eCollection 2023 Mar. EClinicalMedicine. 2023. PMID: 36816344 Free PMC article.
-
Discriminative validity of the EQ-5D-5 L and SF-12 in older adults with arthritis.Health Qual Life Outcomes. 2019 Apr 17;17(1):68. doi: 10.1186/s12955-019-1129-6. Health Qual Life Outcomes. 2019. PMID: 30995930 Free PMC article.
-
The contribution of pain in determining the health status of cancer patients with bone metastases: A secondary analysis of data from three Phase III registration trials.Eur J Pain. 2018 Mar;22(3):565-571. doi: 10.1002/ejp.1139. Epub 2017 Oct 30. Eur J Pain. 2018. PMID: 29082574
Cited by
-
Health-related quality of life and behavior-related lifestyle changes due to the COVID-19 home confinement: Dataset from a Moroccan sample.Data Brief. 2020 Oct;32:106239. doi: 10.1016/j.dib.2020.106239. Epub 2020 Aug 27. Data Brief. 2020. PMID: 32868996 Free PMC article.
-
Valuing health-related quality of life: an EQ-5D-5L value set for Morocco.Qual Life Res. 2025 Jun;34(6):1783-1796. doi: 10.1007/s11136-025-03930-1. Epub 2025 Feb 28. Qual Life Res. 2025. PMID: 40019677 Free PMC article.
-
Health-related quality of life among Moroccan women after vaginal birth and cesarean section: Cross-sectional study.Heliyon. 2024 May 31;10(11):e32276. doi: 10.1016/j.heliyon.2024.e32276. eCollection 2024 Jun 15. Heliyon. 2024. PMID: 38873689 Free PMC article.
-
The high-risk factors of different severities of bronchopulmonary dysplasia (BPD) based on the national institute of child health and human development (NICHD) diagnosis criteria in 2018.J Bras Pneumol. 2021 Sep 29;47(5):e20210125. doi: 10.36416/1806-3756/e20210125. eCollection 2021. J Bras Pneumol. 2021. PMID: 34614093 Free PMC article.
-
An Excel program for calculating statistics presented in Marfak et al.'s article 'Improved RIDIT statistic approach provides more intuitive and informative interpretation of EQ-5D Data'.Health Qual Life Outcomes. 2021 Apr 5;19(1):113. doi: 10.1186/s12955-021-01745-5. Health Qual Life Outcomes. 2021. PMID: 33820569 Free PMC article.
References
-
- Safita N, Islam SM, Chow CK, Niessen L, Lechner A, Holle R, Laxy M. The impact of type 2 diabetes on health related quality of life in Bangladesh: results from a matched study comparing treated cases with non-diabetic controls. Health Qual Life Outcomes. 2016;14(1):129–137. doi: 10.1186/s12955-016-0530-7. - DOI - PMC - PubMed
Publication types
MeSH terms
LinkOut - more resources
Full Text Sources
