. 2020 May;32(5):1665-1688.
doi: 10.1105/tpc.19.00970. Epub 2020 Mar 10.

Specific Recruitment of Phosphoinositide Species to the Plant-Pathogen Interfacial Membrane Underlies Arabidopsis Susceptibility to Fungal Infection

Affiliations

Specific Recruitment of Phosphoinositide Species to the Plant-Pathogen Interfacial Membrane Underlies Arabidopsis Susceptibility to Fungal Infection

Li Qin et al. Plant Cell. 2020 May.

Abstract

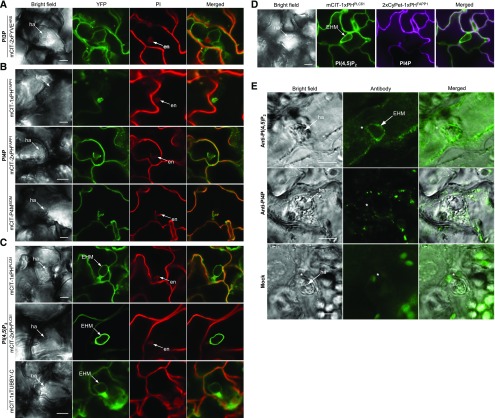
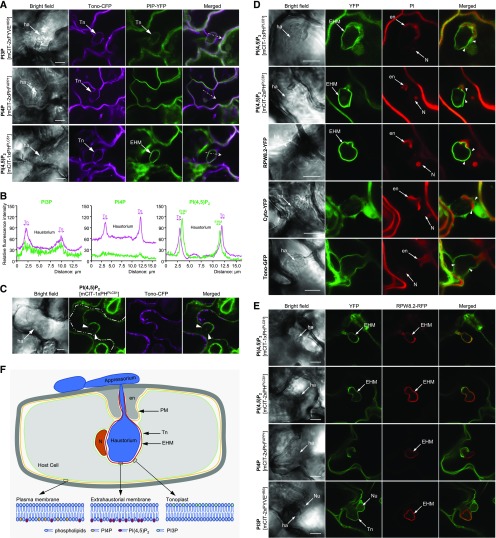
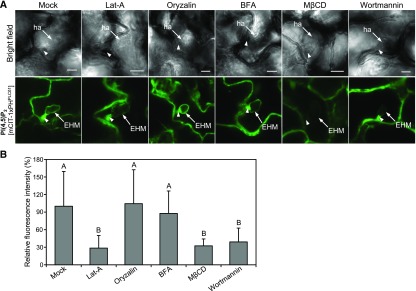
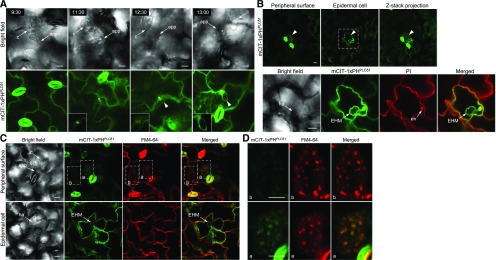
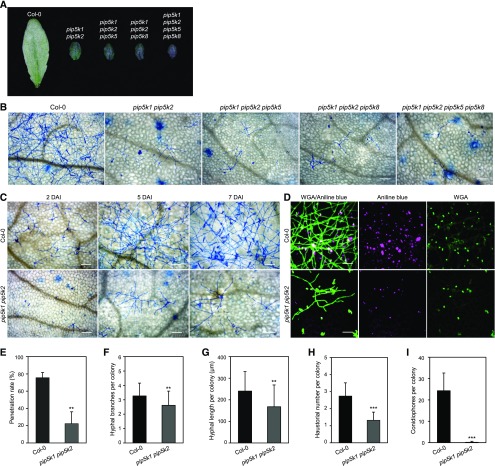
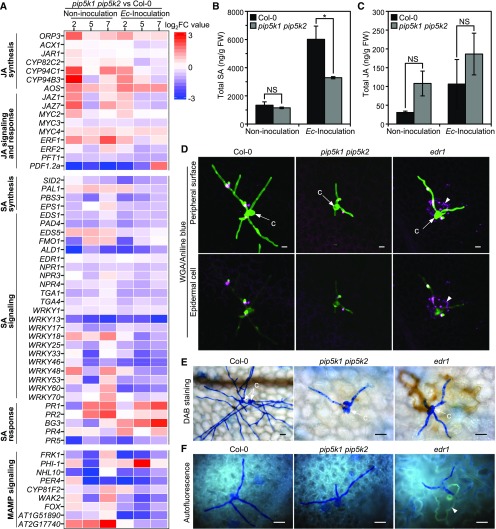
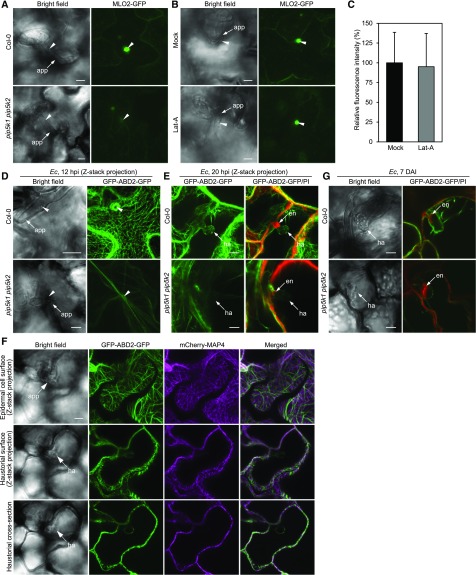
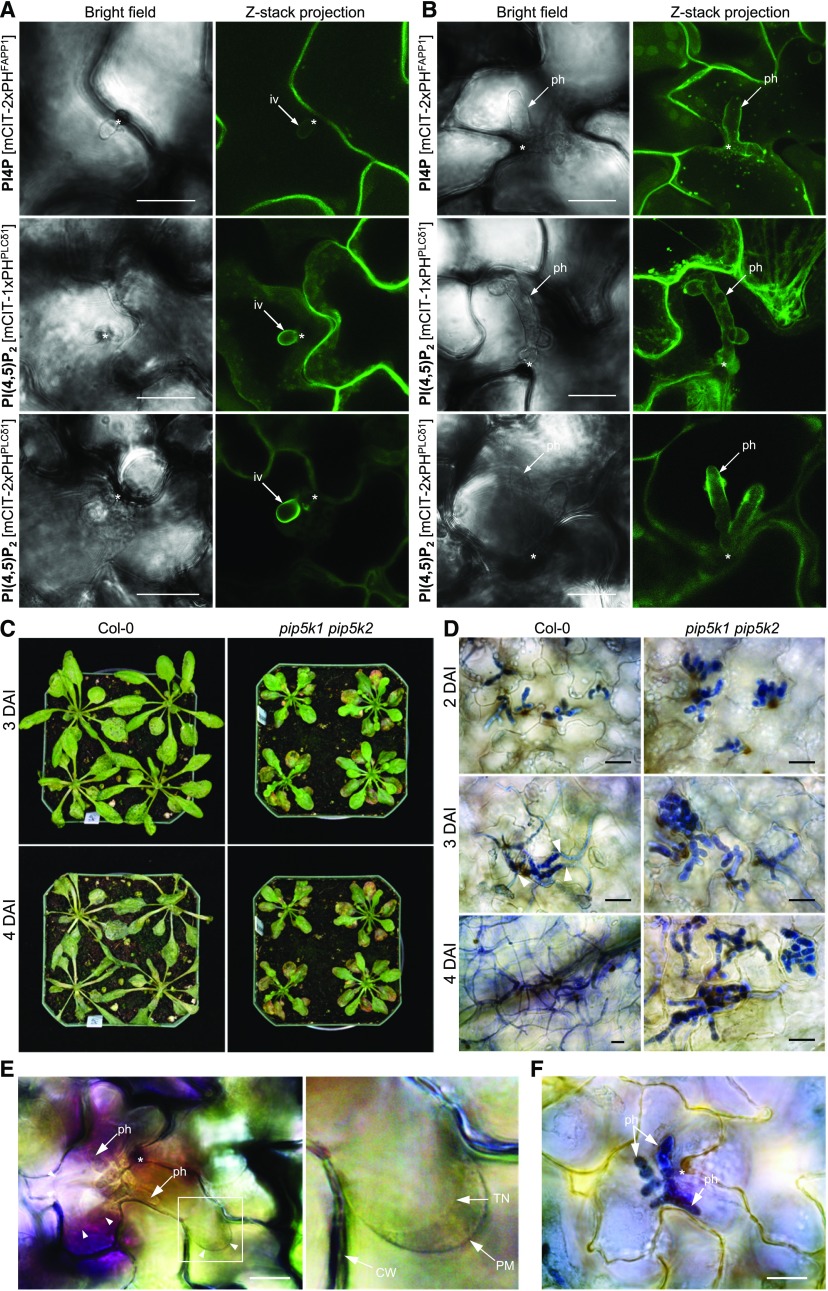
Different phosphoinositides enriched at the membranes of specific subcellular compartments within plant cells contribute to organelle identity, ensuring appropriate cellular trafficking and function. During the infection of plant cells, biotrophic pathogens such as powdery mildews enter plant cells and differentiate into haustoria. Each haustorium is enveloped by an extrahaustorial membrane (EHM) derived from the host plasma membrane. Little is known about the EHM biogenesis and identity. Here, we demonstrate that among the two plasma membrane phosphoinositides in Arabidopsis (Arabidopsis thaliana), PI(4,5)P2 is dynamically up-regulated at powdery mildew infection sites and recruited to the EHM, whereas PI4P is absent in the EHM. Lateral transport of PI(4,5)P2 into the EHM occurs through a brefeldin A-insensitive but actin-dependent trafficking pathway. Furthermore, the lower levels of PI(4,5)P2 in pip5k1 pip5k2 mutants inhibit fungal pathogen development and cause disease resistance, independent of cell death-associated defenses and involving impaired host susceptibility. Our results reveal that plant biotrophic and hemibiotrophic pathogens modulate the subcellular distribution of host phosphoinositides and recruit PI(4,5)P2 as a susceptibility factor for plant disease.


Figures

Figure 1.
Figure 1.
Differential Targeting of Phosphoinositides to the Haustorial Periphery of the Powdery Mildew Ec. (A) to (C) Leaves of Arabidopsis plants expressing biosensors were inoculated with Ec and viewed with a confocal microscope at 2 DAI. Fungal structures and plant cell walls were stained with propidium iodide (PI). en, encasement; ha, haustorium. Bars = 10 µm. (A) Representative images of PI3P biosensor mCIT-2xFYVEHRS. (B) Representative images of PI4P biosensors mCIT-1xPHFAPP1, mCIT-2xPHFAPP1, and mCIT-P4MSiDM. (C) Representative images of PI(4,5)P2 biosensors mCIT-1xPHPLCδ1, mCIT-2xPHPLCδ1, and mCIT-1xTUBBY-C. (D) Simultaneous labeling of PI(4,5)P2 (mCIT-1xPHPLCδ1) and PI4P (2xCyPet-1xPHFAPP1) during haustorium formation at 2 DAI. Bar = 10 µm. (E) Immunofluorescence of Ec-infected leaf epidermal cells with the antibodies to PI(4,5)P2 [anti-PI(4,5)P2] and PI4P (anti-PI4P). Distribution of PI(4,5)P2 and PI4P in Ec-infected cells was revealed by whole-mount immunolocalization of leaf epidermal tissues of Arabidopsis plants at 2 DAI. Images of mock were taken in the absence of primary antibody. Asterisks indicate Ec penetration sites in epidermal cells. Bars = 10 µm.
Figure 2.
Figure 2.
PI(4,5)P2, but Not PI4P, Is Selectively Targeted to the EHM of Powdery Mildew. (A) Representative images of Ec-infected Arabidopsis epidermal cells coexpressing tonoplast marker Tono-CFP and PIP biosensors mCIT-2xFYVEHRS for PI3P, mCIT-2xPHFAPP1 for PI4P, or mCIT-1xPHPLCδ1 for PI(4,5)P2 at 2 DAI. ha, haustorium; Tn, tonoplast. (B) Plots show relative fluorescence intensity along the paths of dotted arrows in left panels corresponding to (A). (C) Arabidopsis leaves coexpressing PI(4,5)P2 biosensor mCIT-1xPHPLCδ1 and Tono-CFP were inoculated with Ec and subjected to plasmolysis at 2 DAI. Cell walls of an infected epidermal cell are marked by a dotted line. After plasmolysis, PI(4,5)P2 signals retained on the haustorial peripheral surface are indicated by arrowheads. (D) Arabidopsis leaves expressing mCIT-1xPHPLCδ1, mCIT-2xPHPLCδ1, RPW8.2-YFP, Cyto-YFP, or Tono-GFP were inoculated with Ec and stained by propidium iodide (PI) at 2 DAI. Arrowheads indicate the boundary between the haustorium and the host nucleus (N). Cell wall, encasement (en), and nucleus were stained with propidium iodide. (E) Representative images of Ec-infected Arabidopsis epidermal cells coexpressing EHM marker RPW8.2-RFP and PIP biosensors mCIT-1xPHPLCδ1 and mCIT-2xPHPLCδ1 for PI(4,5)P2, mCIT-2xPHFAPP1 for PI4P, or mCIT-2xFYVEHRS for PI3P at 2 DAI. (F) Diagram illustrating the distribution of host phosphoinositide species in different membrane compartments associated with an Ec haustorium in infected epidermal cells. Bars = 10 µm.
Figure 3.
Figure 3.
Cellular Trafficking Pathways Responsible for Recruiting PI(4,5)P2 into the EHM. Effects of pharmacological inhibitors on the targeting of PI(4,5)P2 into the EHM are shown. (A) Representative images showing the targeting of mCIT-1xPHPLCδ1 to the EHM at 24 h post Ec inoculation after the indicated treatments. The leaves were infiltrated with mock (water), 5 µM latrunculin A (Lat-A), 1 mM oryzalin, 300 µM BFA, 1 mM MβCD, or 30 µM wortmannin 1 h inoculation with Ec. The haustorial neck regions are indicated by arrowheads. ha, haustorium. Bars = 10 μm. (B) Quantification of relative fluorescence intensity for mCIT-1xPHPLCδ1 at the EHM. Data are normalized over the intensity at the EHM from the mock treatment. Data are means ± sd (n = 30). Different letters indicate statistically significant differences determined by one-way ANOVA with Tukey’s HSD (P < 0.01).
Figure 4.
Figure 4.
Induced PI(4,5)P2 Dynamics in Host Cells in Response to Powdery Mildew Infection. (A) Time-course responses of PI(4,5)P2 dynamics revealed by the mCIT-1xPHPLCδ1 probe in Ec-infected epidermal cells at 9 to 14 hpi. Notably, signals of mCIT-1xPHPLCδ1 were focally accumulated underneath the penetration site initially at ∼11 hpi and then targeted the EHM during haustorial development. Asterisks indicate the penetration sites that are enlarged in insets for close views; arrowheads indicate the EHM. (B) Enhanced production of PI(4,5)P2 specifically in Ec-colonized cells. The bottom row shows enlarged views of an Ec-colonized cell at 24 hpi, showing enhanced PI(4,5)P2 signals at the EHM as well as along the PM of the infected cell. Fungal structures and plant cell walls were stained with PI. Induced accumulation was observed in 47 of 79 Ec-colonized cells. (C) and (D) Association of induced PI(4,5)P2 production with PM and endocytic processes in Ec-colonized cells. Ec-inoculated leaves at 24 hpi were incubated in FM4-64 for 15 min. (C) An Ec-infected cell (a) and a neighboring noninfected cell (b) are highlighted in dash-lined boxes. The same inoculation sites were viewed on the peripheral surface (top) or inside the cell (bottom) of leaf epidermis. (D) Enlarged views of an Ec-infected cell (a) and a noninfected cell (b). Note that PI(4,5)P2 signal revealed by mCIT-1xPHPLCδ1 was induced only in the Ec-colonized cell and colocalized with FM4-64-labeled endocytic PM compartments on the peripheral surface of the infected cell. app, appressorium; c, conidium; en, encasement; ha, haustorium. Bars = 10 µm.
Figure 5.
Figure 5.
Loss of PIP5K1 and PIP5K2 Functions Prevented Growth and Development of the Compatible Powdery Mildew Fungus. (A) Macroscopic infection phenotypes of double (pip5k1 pip5k2), triple (pip5k1 pip5k2 pip5k5 and pip5k1 pip5k2 pip5k8), and quadruple (pip5k1 pip5k2 pip5k5 pip5k8) mutant plants at 10 DAI with Ec. (B) Impaired growth and development of Ec on the indicated genotypes at 7 DAI with Ec. Leaf tissues were stained with aniline blue and viewed by light microscopy. Bars = 100 μm. (C) Time course showing the development of Ec on mature leaves of the pip5k1 pip5k2 mutant. Leaf tissues of wild-type and pip5k1 pip5k2 plants at 2, 5, and 7 DAI were stained with aniline blue and viewed by light microscopy. Bars = 100 μm. (D) Reduced formation of haustoria in mutant pip5k1 pip5k2. Fungal structures on the leaf surfaces (left) and haustoria in epidermal cells (right) at 7 DAI were stained with Alexa Fluor 488-conjugated wheat germ agglutinin (WGA), while callose deposition (middle) was detected by aniline blue. Images were taken with a confocal microscope with maximum projection of Z-stacks. Bars = 50 μm. (E) to (I) Quantitative analysis of Ec growth on leaves of wild-type and pip5k1 pip5k2 plants. **, P < 0.01 and ***, P < 0.001, Student’s t test. (E) Penetration rate of Ec. More than 100 sites for each leaf were scored at 2 DAI. Data are means ± sd (n = 4). (F) and (G) Branch numbers (F) and total lengths (G) of secondary hyphae per colony at 2 DAI. Data are means ± sd (n = 75 [wild type] or 31 [pip5k1 pip5k2]). (H) Haustorial numbers per colony at 2 DAI. Data are means ± sd (n = 31 [wild type] or 31 [pip5k1 pip5k2]). (I) Number of conidiophores per colony at 7 DAI. Conidiophores were counted from at least 30 colonies in five leaves for each genotype, which was repeated three times with similar results. Data are means ± sd (n = 30).
Figure 6.
Figure 6.
Defense Responses in pip5k1 pip5k2 Mutants against Powdery Mildew Infection. (A) Transcriptomic profiling of differentially expressed genes in SA and JA biosynthesis, signaling and response pathways, and MAMP signaling between pip5k1 pip5k2 mutant and Col-0 plants without or with Ec inoculation at 2, 5, and 7 DAI. Heat maps display log2 fold change (log2FC) values for pairwise comparison between the pip5k1 pip5k2 mutant and Col-0 at each time point. (B) and (C) Levels of SA and JA in Col-0 and the pip5k1 pip5k2 mutant. Total amounts of SA (B) and JA (C) were measured in leaf tissues without or with Ec inoculation at 5 DAI. Data are means ± sd (n = 3 biological replicates). *, P < 0.05; NS, no significant difference, Student’s t test. FW, fresh weight. (D) to (F) Detection of callose deposition, H2O2 accumulation, and autofluorescence material production in Ec-infected Col-0, pip5k1 pip5k2, and edr1 plants at 48 hpi. Arrowheads indicate cell death in the edr1 mutant accompanied by callose deposition, H2O2 accumulation, and autofluorescence. c, conidia. Bars = 20 μm. (D) Callose deposition. Ec-inoculated leaves were fixed and stained by both aniline blue and Alexa Fluor 488-conjugated wheat germ agglutinin (WGA). The images were obtained by merging the confocal optical sections (Z-stacks). (E) H2O2 production. Ec-inoculated fresh leaves were stained by 3,3'-diaminobenzidine, fixed, and viewed by compound microscopy. H2O2 accumulation is indicated by brownish color. (F) Accumulation of autofluorescence materials. Ec-inoculated leaves were fixed, and the autofluorescence was directly viewed by fluorescence microscopy.
Figure 7.
Figure 7.
Impaired Cellular Responses Associated with Host Susceptibility to Powdery Mildew Infection in the pip5k1 pip5k2 Mutant. (A) Recruitment of MLO2-GFP into Ec penetration sites is impaired in pip5k1 pip5k2. Leaves of Col-0 and pip5k1 pip5k2 plants expressing MLO2:MLO2-GFP at 13 hpi were examined by confocal microscopy. The images were obtained by merging the confocal optical sections (Z-stacks). (B) and (C) Focal aggregation of MLO2-GFP at Ec penetration sites is regulated via an actin-independent mechanism. Leaves of Col-0 plants expressing MLO2:MLO2-GFP were infiltrated with water (Mock) or 5 μM latrunculin A (Lat-A) and subsequently inoculated with Ec. At 13 hpi, the infected epidermal cells were examined by confocal microscopy. (B) Representative images obtained by merging the confocal optical sections (Z-stacks). (C) Relative fluorescence intensity of MLO2-GFP around penetration sites. Quantification was performed over 30 sites per treatment. Data are means ± sd (n = 30). P = 0.665, Student’s t test. (D) to (G) Dynamics of AFs at the Ec penetration sites and on the peripheral surface of haustoria in leaf tissues of Col-0 and pip5k1 pip5k2 plants expressing GFP-ABD2-GFP. (D) Spatial organization of AFs underneath the Ec penetration sites at 12 hpi. (E) Spatial organization of AFs on the haustorial surface during haustorial development at 20 hpi. (F) AFs but not microtubules dynamically reorganized on the haustorial surface. Leaves of Col-0 plants simultaneously expressing GFP-ABD2-GFP and mCherry-MAP4 at 20 hpi were examined by confocal microscopy. The same inoculation sites are viewed on the peripheral surface of leaf epidermis (top row; Z-stacks), on the haustorial surface (middle row; Z-stacks), or on the haustorial cross section (bottom row; single section). (G) Dynamic responses of AFs associated with mature haustoria at 7 DAI. Arrowheads indicate the Ec penetration site. app, appressorium; en, encasement; ha, haustorium. Bars = 10 μm.
Figure 8.
Figure 8.
Regulation of PI(4,5)P2 Controls Disease Development in Plants and the Lifestyle of the Hemibiotrophic Fungal Pathogen Ch. (A) and (B) Association of the PI4P biosensor mCIT-2xPHFAPP1 and the PI(4,5)P2 biosensors mCIT-1xPHPLCδ1 and mCIT-2xPHPLCδ1 with the biotrophic stages of the Ch life cycle. Both PI4P and PI(4,5)P2 signals targeted the surface of infection vesicles (iv; [A]) and primary hyphae (ph; [B]). Asterisks indicate the penetration sites. (C) Disease development on Col-0 and pip5k1 pip5k2 plants. Ch-inoculated plants were photographed at 3 and 4 DAI. (D) Microscopic images of Ch-infected leaf tissues. In pip5k1 pip5k2 leaves, extensive bulbous primary hyphae were restricted within the first infected epidermal cells during the infection time course 2 to 4 DAI, whereas in Col-0 plants, thin necrotrophic hyphae developed at 3 DAI and rapidly spread into neighboring cells. Infected leaf tissues were stained with trypan blue. (E) and (F) Extended biotrophic stages of Ch infection in the pip5k1 pip5k2 mutant. (E) Viability of Ch-infected cells at 4 DAI is shown by the host protoplasm contracting from the cell wall (CW) after plasmolysis. The right panel shows an enlarged view of the boxed area in which tonoplast (TN) is clearly distinguishable from the PM. (F) Leaf sample showing that the same Ec-infected site in (E) was fixed and stained for fungal hyphae with trypan blue. Bars = 20 μm.
None

Comment in

References

    1. Anders S., Pyl P.T., Huber W.(2015). HTSeq: A Python framework to work with high-throughput sequencing data. Bioinformatics 31: 166–169. - PMC - PubMed
    1. Asai T., Tena G., Plotnikova J., Willmann M.R., Chiu W.-L., Gomez-Gomez L., Boller T., Ausubel F.M., Sheen J.(2002). MAP kinase signalling cascade in Arabidopsis innate immunity. Nature 415: 977–983. - PubMed
    1. Berkey R., Zhang Y., Ma X., King H., Zhang Q., Wang W., Xiao S.(2017). Homologues of the RPW8 resistance protein are localized to the extrahaustorial membrane that is likely synthesized de novo. Plant Physiol. 173: 600–613. - PMC - PubMed
    1. Bhat R.A., Miklis M., Schmelzer E., Schulze-Lefert P., Panstruga R.(2005). Recruitment and interaction dynamics of plant penetration resistance components in a plasma membrane microdomain. Proc. Natl. Acad. Sci. USA 102: 3135–3140. - PMC - PubMed
    1. Bolger A.M., Lohse M., Usadel B.(2014). Trimmomatic: A flexible trimmer for Illumina sequence data. Bioinformatics 30: 2114–2120. - PMC - PubMed

Publication types

MeSH terms

Substances